. 2011 Aug 2:7:522.
doi: 10.1038/msb.2011.54.

AlleleSeq: analysis of allele-specific expression and binding in a network framework

Affiliations

AlleleSeq: analysis of allele-specific expression and binding in a network framework

Joel Rozowsky et al. Mol Syst Biol. .

Abstract

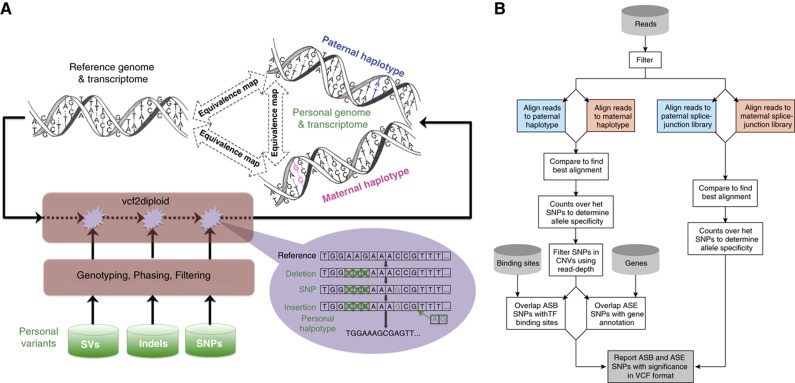
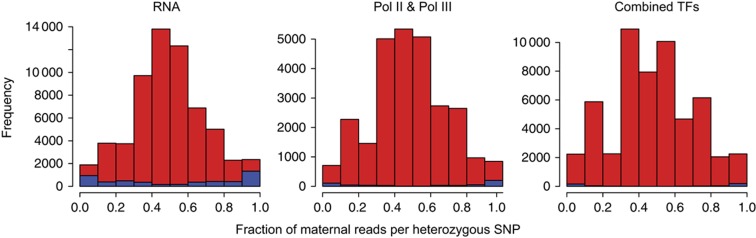
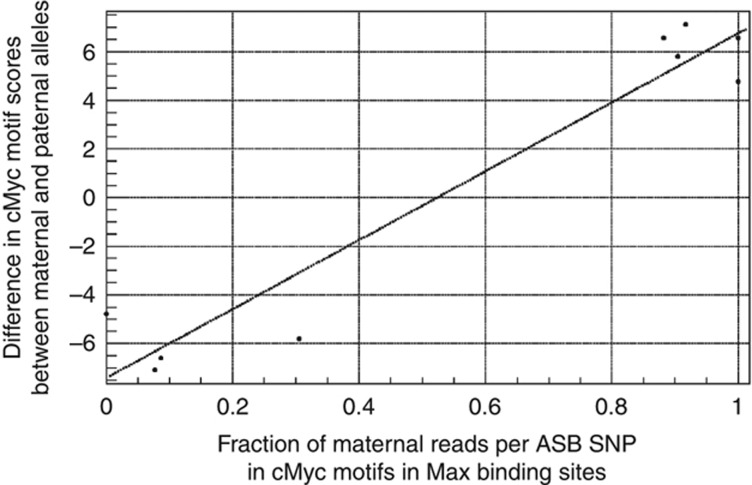
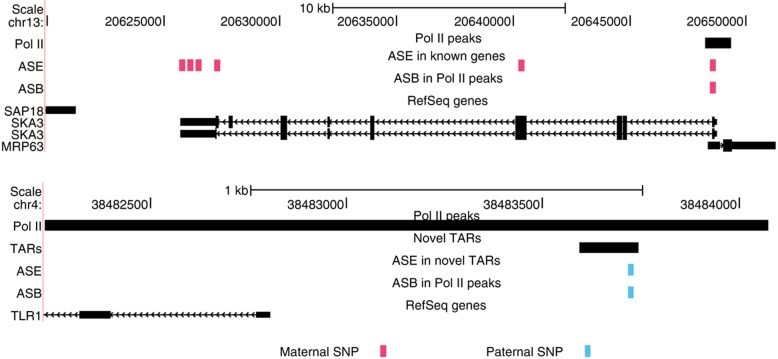
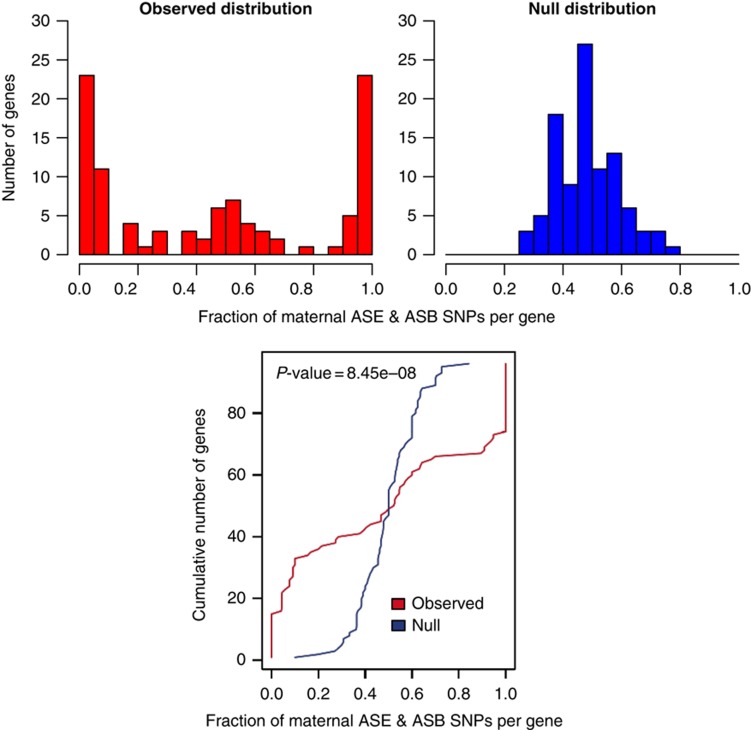
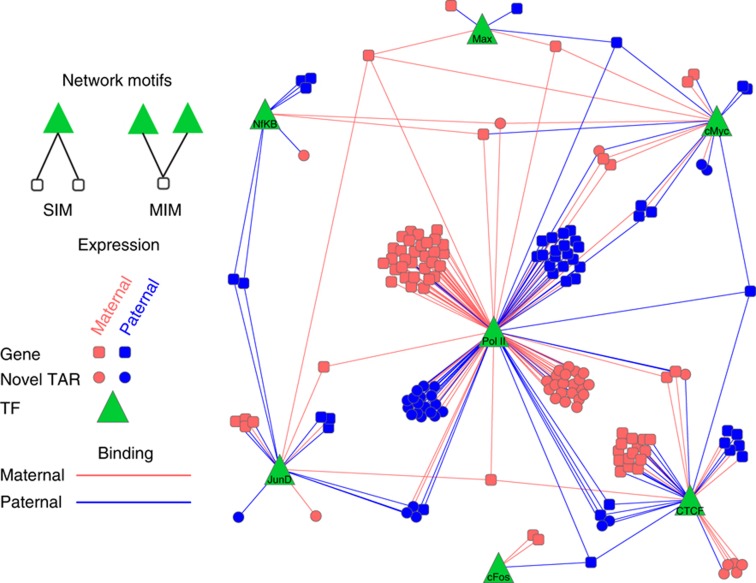
To study allele-specific expression (ASE) and binding (ASB), that is, differences between the maternally and paternally derived alleles, we have developed a computational pipeline (AlleleSeq). Our pipeline initially constructs a diploid personal genome sequence (and corresponding personalized gene annotation) using genomic sequence variants (SNPs, indels, and structural variants), and then identifies allele-specific events with significant differences in the number of mapped reads between maternal and paternal alleles. There are many technical challenges in the construction and alignment of reads to a personal diploid genome sequence that we address, for example, bias of reads mapping to the reference allele. We have applied AlleleSeq to variation data for NA12878 from the 1000 Genomes Project as well as matched, deeply sequenced RNA-Seq and ChIP-Seq data sets generated for this purpose. In addition to observing fairly widespread allele-specific behavior within individual functional genomic data sets (including results consistent with X-chromosome inactivation), we can study the interaction between ASE and ASB. Furthermore, we investigate the coordination between ASE and ASB from multiple transcription factors events using a regulatory network framework. Correlation analyses and network motifs show mostly coordinated ASB and ASE.


Conflict of interest statement

The authors declare that they have no conflict of interest.

Figures

Figure 1
Figure 1
(A) Construction of a personal genome by vcf2diploid tool is made by incorporating personal variants into the reference genome. Personal variants may require additional pre-processing, that is, filtering, genotyping, and/or phasing. The output is the two (paternal and maternal) haplotypes of personal genome. During the construction step, the reference genome is represented as an array of nucleotides with each cell representing a single base. Iteratively, the nucleotides in the array are being modified to reflect personal variations. Once all the variations have been applied, a personal haplotype is constructed by reading through the array. Simultaneously, equivalence map (MAP-file format—see Supplementary Figure 1) between personal haplotypes and reference genome is being constructed. This can similarly be done for a personal transcriptome. (B) AlleleSeq pipeline for determining allele-specific binding (ASB) and allele-specific expression (ASE) aligning reads against the personal diploid genome sequence as well as a diploid-aware gene annotation file (including splice-junction library).
Figure 2
Figure 2
For each heterozygous SNP location covered at a depth greater than six, we can compute the fraction of reads derived from the alternative allele relative to the reference sequence. We then plotted the distribution of alternative allele fraction for all heterozygous SNPs (significant allele-specific positions are indicated in blue) for the RNA-Seq, Pol II, and remaining ChIP-Seq data sets combined. We observe that the distribution of all heterozygous SNPs as well as the allele-specific SNP positions is quite symmetric; and thus, we do not see a significant reference bias.
Figure 3
Figure 3
We plot the difference of motif scores (see Materials and methods) between the maternal and paternal alleles against the fraction of maternally derived reads for ASB SNPs overlapping motifs within binding sites. Here, we plot this for ASB SNPs in cMyc motifs that are located within Max binding sites. We see a strong correlation indicating that the motif with the stronger match tends to be on the allele that is preferentially bound.
Figure 4
Figure 4
Examples showing ASE and ASB for a gene (SKA3 on chromosome 13) and a novel TAR (on chromosome 4). Paternal SNPs exhibiting either ASE or ASB are indicated in blue and corresponding maternal SNPs are indicated in red. We also indicate the region of enriched Pol II binding in black. For these two examples, we see coordinated maternal binding and expression for the known gene and coordinated paternal binding and expression for the novel TAR.
Figure 5
Figure 5
We compare the degree of coordination in the maternal or paternal preference of ASB and ASE SNPs within a gene, to that of a random null distribution. All genes that contain 10 or more such SNPs across all our GM12878 data sets are included. Using this set of genes and number of SNP per gene, a null distribution is generated. The null hypothesis is that each SNP within a gene has an independent 50/50 chance of being maternal or paternally biased. The histograms show the distribution of maternal fraction across all genes, compared with that for the null distribution. The observed data show a strong tendency toward either zero or one, indicating that, within a gene, the SNPs have a strong tendency to be either mostly maternal or paternal. The lower graph displays the results of a Kolmolgorov–Smirnov test to support the claim that the two distributions are significantly different, with a P-value of 8.45e−8 (maximal difference is indicate with a green line).
Figure 6
Figure 6
This figure shows a regulatory network of genes and novel TARs that are regulated by TFs in an allele-specific manner. The TFs are represented by green triangles, while the genes and novel TARs are represented by squares and circles, respectively. The color of the genes and tars are representative of their allele-specific expression and the edges from TFs, which represent regulation by TFs, to them likewise; the colors used are pink for maternal, and blue for paternal. As it can be observed, there is significant agreement between allele-specific regulation and allele-specific binding.

References

    1. Abyzov A, Urban AE, Snyder M, Gerstein M (2011) CNVnator: an approach to discover, genotype, and characterize typical and atypical CNVs from family and population genome sequencing. Genome Res 21: 974–984 - PMC - PubMed
    1. Adey A, Morrison HG, Asan, Xun X, Kitzman JO, Turner EH, Stackhouse B, Mackenzie AP, Caruccio NC, Zhang X, Shendure J (2010) Rapid, low-input, low-bias construction of shotgun fragment libraries by high-density in vitro transposition. Genome Biol 11: R119. - PMC - PubMed
    1. Bertone P, Stolc V, Royce TE, Rozowsky JS, Urban AE, Zhu X, Rinn JL, Tongprasit W, Samanta M, Weissman S, Gerstein M, Snyder M (2004) Global identification of human transcribed sequences with genome tiling arrays. Science 306: 2242–2246 - PubMed
    1. Cline MS, Smoot M, Cerami E, Kuchinsky A, Landys N, Workman C, Christmas R, Avila-Campilo I, Creech M, Gross B, Hanspers K, Isserlin R, Kelley R, Killcoyne S, Lotia S, Maere S, Morris J, Ono K, Pavlovic V, Pico AR et al. (2007) Integration of biological networks and gene expression data using Cytoscape. Nat Protoc 2: 2366–2382 - PMC - PubMed
    1. Degner JF, Marioni JC, Pai AA, Pickrell JK, Nkadori E, Gilad Y, Pritchard JK (2009) Effect of read-mapping biases on detecting allele-specific expression from RNA-sequencing data. Bioinformatics 25: 3207–3212 - PMC - PubMed

Publication types