. 2011 Aug 2;30(19):4006-19.
doi: 10.1038/emboj.2011.256.

A cluster of ribosome synthesis factors regulate pre-rRNA folding and 5.8S rRNA maturation by the Rat1 exonuclease

Affiliations

A cluster of ribosome synthesis factors regulate pre-rRNA folding and 5.8S rRNA maturation by the Rat1 exonuclease

Sander Granneman et al. EMBO J. .

Abstract

The 5'-exonuclease Rat1 degrades pre-rRNA spacer fragments and processes the 5'-ends of the 5.8S and 25S rRNAs. UV crosslinking revealed multiple Rat1-binding sites across the pre-rRNA, consistent with its known functions. The major 5.8S 5'-end is generated by Rat1 digestion of the internal transcribed spacer 1 (ITS1) spacer from cleavage site A(3). Processing from A(3) requires the 'A(3)-cluster' proteins, including Cic1, Erb1, Nop7, Nop12 and Nop15, which show interdependent pre-rRNA binding. Surprisingly, A(3)-cluster factors were not crosslinked close to site A(3), but bound sites around the 5.8S 3'- and 25S 5'-regions, which are base paired in mature ribosomes, and in the ITS2 spacer that separates these rRNAs. In contrast, Nop4, a protein required for endonucleolytic cleavage in ITS1, binds the pre-rRNA near the 5'-end of 5.8S. ITS2 was reported to undergo structural remodelling. In vivo chemical probing indicates that A(3)-cluster binding is required for this reorganization, potentially regulating the timing of processing. We predict that Nop4 and the A(3) cluster establish long-range interactions between the 5.8S and 25S rRNAs, which are subsequently maintained by ribosomal protein binding.


Conflict of interest statement

The authors declare that they have no conflict of interest.

Figures

Figure 1
Figure 1
Pre-rRNA processing and protein interactions. (A) Schematic representation of pre-rRNA processing in yeast. The locations of processing sites on the 35S pre-rRNA are indicated. The positions of oligonucleotides used for northern hybridization (020) and primer extension (007) are shown. In the nucleolus, the 35S pre-rRNA, part of a 90S-sized complex called the SSU processome or 90S pre-ribosome, is processed at sites A0, A1 and A2, leading to the formation of 43S and 66S pre-ribosomes. Proteins studied in the CRAC analysis and their association with pre-ribosomal complexes are indicated. The 43S pre-ribosome is exported to the cytoplasm where Nob1 cleaves at site D, yielding the mature 18S rRNA and 40S subunit. 66S pre-ribosomes containing 27SA2 pre-rRNA are either processed at A3 or at B1L, which requires the presence of Nop4. Pre-ribosomes containing 27SA3 pre-rRNA are exonucleolytically trimmed by the Rat1, Rrp17 and Xrn1 5′–3′ exonucleases, yielding the 27SBS pre-rRNA. This maturation step requires the presence of Nop12, Nop7, Nop15 and Erb1 (depicted as coloured circles). After this step, the 27SB is cleaved at C2 by an unknown endonuclease, followed by exonucleolytic and endonucleolytic trimming of 7S by Rrp6 and Rrp44, two components of the exosome complex. Pre-ribosomes containing the 6S pre-rRNA are exported to the cytoplasm and matured by Ngl2 after which Nop12 and Nop4 dissociate. (B) Overview of known and predicted protein–protein interactions in 66S pre-ribosomes. The interaction map depicts interactions between the various assembly factors and r-proteins in 66S pre-ribosomes. Black lines; physical interactions among proteins shown to be part of subcomplexes or interacting as recombinant proteins (Krogan et al, 2004; Miles et al, 2005). Dashed red lines; yeast two-hybrid interactions (Ito et al, 2001; Miles et al, 2005). Red lines; interactions from protein-fragment complementation assays (PCAs), which detect proteins located within ∼80 Å (Tarassov et al, 2008). Dashed black lines; protein–protein interactions predicted from our CRAC data. Note that these may be mediated by RNA.
Figure 2
Figure 2
Rat1 crosslinking sites over the pre-rRNAs. (A) Rat1 crosslinks primarily to spacer regions in the pre-rRNA. A histogram that displays the distribution of rDNA-mapped reads along the entire rDNA sequence is shown. The red line indicates 100 000 averaged hits from two independent Rat1 CRAC experiments. The blue line indicates the distribution of 10 000 rDNA hits from the negative control experiment. The asterisks indicate frequent contaminants. The rDNA is schematically represented below the x axis, with processing sites included. The y axis displays the total number of times a nucleotide within an RNA fragment was mapped to the rDNA sequence. (B) The dashed lines point to expanded views of hits over the 5′-ETS and ITS1-25S region with schematics showing Rat1 substrates. Positions of potential crosslinking sites in spacer regions are shown in Supplementary Figure S9.
Figure 3
Figure 3
Overview of CRAC results and locations of protein–RNA interaction sites in the 25S and 5.8S rRNA secondary structures. (A) Results from 2 to 5 independent CRAC experiments. (B) Results from untagged strain. (C) Illumina-Solexa results from Nop4 (red line) and negative control (untagged strain; blue line). Sequences were aligned to the rDNA reference sequence using blast and plotted using gnuplot. Locations of mature rRNA sequences, spacers and cleavage site are indicated below the x axis. The y axis displays the total number of times each nucleotide within an RNA fragment was mapped to the reference sequence. The location of the peaks in the secondary structure of the rRNA is indicated with helix (H) numbers (Klein et al, 2004). The asterisks indicate frequent contaminants. (D) Locations of minimal binding sites for the ribosome synthesis factors are displayed on the 5.8S/25S rRNA secondary structures (http://www.rna.ccbb.utexas.edu/) and the ‘ring model’ for yeast ITS2 structure (Joseph et al, 1999; Cote et al, 2002). Large 25S rRNA domains are indicated with dashed boxes. The 5.8S rRNA sequence is coloured red. Locations of r-protein binding sites are boxed, based on their locations in the yeast 60S crystal structure (Ben-Shem et al, 2010) and previous genetic studies (van Beekvelt et al, 2000). Two Rat1 binding sites in helices 3/5 and 11 are shown in light blue. Crosslinking sites in the spacer regions are shown in Supplementary Figure S9.
Figure 4
Figure 4
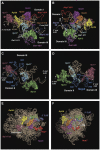
Location of Nop4, Nop7, Erb1 and Nop12 and RNA binding sites in 60S crystal structure. (A, B) Images, rotated by 90°, showing the protein neighbourhood around the 3′-end of the yeast 5.8S rRNA. The 5.8S rRNA is shown in wheat color, with binding sites for Nop12 (orange and blue), Nop7 (red) and Erb1 (purple) indicated as coloured nucleotide strands. Images were generated using pymol. Ribosomal proteins (Rpl15, Rpl17, Rpl25, Rpl26, Rpl35 and Rpl37) binding to this region are indicated as surface representations. Helix numbers are indicated with ‘H’. The double arrows indicate the distance (in Å) between the 3′-end region of 5.8S and the Nop7 and Erb1 binding sites. (C, D) Images showing the location of the Nop4 (blue) binding sites that surround the 5′-end of 5.8S. Ribosomal proteins Rpl15, Rpl17 and Rpl37 that bind in this region are indicated as surface representations. Helix numbers are indicated with ‘H’. (E, F) Images showing the location of the Nop7 (red) binding site in the structure of the 25S rRNA (wheat color) and 5.8S 3′-end (light blue). Superimposed are structures for r-proteins Rpl35 (orange), Rpl25 (dark purple) and Rpl15 (green), Rpl26 (yellow) and Rpl17 (light purple). The polypeptide exit tunnel is indicated. The double arrow indicates the distance (in Å) between the 3′-end of 5.8S and the base of the helix containing the Nop7 binding site.
Figure 5
Figure 5
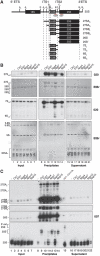
Nop4, Nop7, Nop12, Erb1 and Nop15 associate with 66S pre-rRNAs. Immunoprecipitations were performed with HTP-tagged proteins and the non-tagged parental strain (−lanes). (A) Schematic representation of pre-rRNA species that are detected by oligonucleotides 020 and 007. Red lines indicate the positions of these oligonucleotides on the rDNA. RNAs were resolved on 1.2% agarose and 8% polyacrylamide/7 M urea gels and detected by northern hybridization (B) or primer extension (C) using oligonucleotides 020 and 007, respectively (Supplementary Table S1). Input and supernatant indicate 0.1% of RNA extracted from cell lysates and supernatants after immunoprecipitation. Note that in the northern blots shown in (B) longer exposures are shown for inputs and supernatants. Rat1-1/xrn1Δ primer extension products were loaded (C, lane 15) as markers for 26S and 5′-extended (5′-ext) 25S.
Figure 6
Figure 6
Rat1 can bind helices 3, 4 and 11 in pre-rRNA independently of Nop4 and Nop15. (A) Depletion of Nop4 and A3-cluster protein Nop15 reduces binding to the 3′ 5.8S–5′ ITS2 region but does not affect crosslinking to the 5′-ETS and helices 3, 4 and 11. Average hits for each nucleotide in the rDNA were calculated using 2000 rDNA reads from two independent experiments. Hit densities are the sum of hits for each nucleotide in a nucleotide sequence and were plotted as percentages relative to the results of the Rat1-HTP CRAC experiments. (B, C) Distribution of reads mapped to the 5′-ETS (B) and the 5.8S-ITS2 regions (C, D). Average hits per nucleotide from 2000 rDNA-mapped reads from two independent experiments are shown. Reads mapped to the 5′ ETS are shown in (C), whereas reads mapped to ITS1-5.8S-ITS2 region are shown in (D). The shaded area in (D) covers the region from which hit densities were calculated.
Figure 7
Figure 7
Cic1 and Nop15 are required to maintain a flexible RNA conformation in the 5′-end of ITS2. (A, B) The 5′-end of ITS2 adopts a different conformation in Nop15- and Cic1-depleted cells. Parental strain (BY4741), and Nop4, Nop15 and Cic1 GAL depletion strains were grown in YPG/R to exponential phase and subsequently grown for 12 h in glucose. Dimethyl-sulphate (DMS) probing was performed in vivo in cell culture (lanes 1–4) or on in vitro refolded total RNA extracted from the same cultures (lanes 9–12). To control for natural primer extension stops, primer extension was performed on unmodified total RNA (lanes 5–8). DMS modifications were mapped by primer extension and detected by autoradiography following gel electrophoresis. The positions of the modified nucleotides are indicated on the right side of each panel. Results for the ITS1 and 5.8S are shown in Supplementary Figure S7. Oligonucleotides used for primer extensions (Supplementary Table S1) are indicated below each panel. Position of helices and RNA domains is indicated on the left of each panel. Coloured circles indicate changes in DMS reactivity in Nop15 (green circles) and Cic1-depleted cells (purple circles). Small circles depict weak DMS modifications; closed circles indicate an increased DMS reactivity; open circles indicate a decreased DMS reactivity. (C, D) Overview of the chemical probing results on the ‘ring’ (C) and ‘hairpin’ secondary structure models for ITS2. Positions of processing sites (C1, C2 and E) are indicated by arrows. Changes in DMS modifications are highlighted as described above. Red circles indicate nucleotides that were methylated in vitro, whereas black circles indicate in vivo modified nucleotides. (E) Quantification of primer extension results shown in (A). The data were normalized by removing differences in signal intensity between lanes. Y axis indicates the signal intensities calculated by the AIDA software. X axis indicates pixel positions in the lanes. Positions of 5.8S sequences and ITS2 domains II, III and IV are indicated below the x axis.
Figure 8
Figure 8
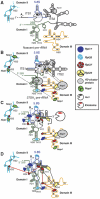
Speculative model for the reorganization of the ITS1-5.8S–ITS2-25S region during Rat1-dependent removal of ITS1. (A) Schematic representation of the secondary structure of the nascent pre-rRNA. Domain I of the 25S rRNA sequence is indicated in green, domain II is indicated in light blue, domain III is indicated in orange and 5.8S rRNA is indicated in dark blue. ITS2 is drawn in the ‘ring’ conformation predicted for the nascent transcript (Joseph et al, 1999). Rat1 binds before A3 cleavage and is depicted on 5.8S H3/4, whereas Cic1 and Nop15 are depicted in grey bound to the ITS2 ‘ring’ conformation. (B) Binding sites for the A3-cluster proteins are indicated in grey. Nop4 binding sites are indicated in green. Interactions between these factors (dashed black lines) are predicted to bring all of these positions into close proximity. Coloured segments represent binding sites for r-proteins Rpl25, Rpl26, Rpl37 and Rpl17. These proteins each contact multiple rRNA sequences that are dispersed in the 1° and 2° structures but associate in the ribosomal particles. Stable pre-rRNA binding by these r-proteins requires the A3-cluster proteins (Sahasranaman et al, submitted), which may bring together the dispersed components of the r-protein binding sites. Major Rat1 binding sites are located in the 5′-ends of 5.8S and 25S, which are independent of the A3-cluster protein Nop15 and Nop4. In the absence of the A3 cluster, we speculate that the 5′-end of ITS2 rapidly adopts a highly base-paired conformation preventing access to A3 and C2 for Rat1, bound to 5.8S H3/4 and/or 25S H11, which are in close proximity. Interactions between Rat1 and sequences 5′ to A3 and C2 likely precede cleavage, but have been omitted for simplicity. (C) Degradation of ITS1 by Rat1 makes the 5′-end of the 5.8S rRNA (blue) accessible for base pairing with the 25S rRNA sequences (green), resulting in the formation of 5.8S–25S interactions H3 and H4. We speculate that formation of these stem structures triggers stable binding of r-protein Rpl17, Rpl26 and Rpl37. After removal of ITS1, ITS2 is cleaved at C2. The ITS2 3′-region is very rapidly processed back to the 25S 5′-end, and we predict that this involves Rat1 bound at 25S H11. Degradation of ITS2 is likely accompanied by removal of Nop15 and Cic1. (D) The remaining A3-cluster proteins dissociate from the mature 25S rRNA and 6S pre-rRNA. Long-range interactions that were initially established by the A3-cluster proteins are now maintained by the r-proteins via their multipartite binding elements (indicated by coloured lines).

References

    1. Babiano R, de la Cruz J (2010) Ribosomal protein L35 is required for 27SB pre-rRNA processing in Saccharomyces cerevisiae. Nucleic Acids Res 38: 5177–5192 - PMC - PubMed
    1. Ben-Shem A, Jenner L, Yusupova G, Yusupov M (2010) Crystal structure of the eukaryotic ribosome. Science 330: 1203–1209 - PubMed
    1. Bergès T, Petfalski E, Tollervey D, Hurt EC (1994) Synthetic lethality with fibrillarin identifies NOP77p, a nucleolar protein required for pre-rRNA processing and modification. EMBO J 13: 3136–3148 - PMC - PubMed
    1. Brachmann CB, Davies A, Cost GJ, Caputo E, Li J, Hieter P, Boeke JD (1998) Designer deletion strains derived from Saccharomyces cerevisiae S288C: a useful set of strains and plasmids for PCR-mediated gene disruption and other applications. Yeast 14: 115–132 - PubMed
    1. Cote CA, Greer CL, Peculis BA (2002) Dynamic conformational model for the role of ITS2 in pre-rRNA processing in yeast. RNA 8: 786–797 - PMC - PubMed

Publication types

MeSH terms