Review
. 2011 Oct;31(10):1986-98.
doi: 10.1038/jcbfm.2011.107. Epub 2011 Aug 3.

Image-derived input function for brain PET studies: many challenges and few opportunities

Affiliations
Review

Image-derived input function for brain PET studies: many challenges and few opportunities

Paolo Zanotti-Fregonara et al. J Cereb Blood Flow Metab. 2011 Oct.

Abstract

Quantitative positron emission tomography (PET) brain studies often require that the input function be measured, typically via arterial cannulation. Image-derived input function (IDIF) is an elegant and attractive noninvasive alternative to arterial sampling. However, IDIF is also a very challenging technique associated with several problems that must be overcome before it can be successfully implemented in clinical practice. As a result, IDIF is rarely used as a tool to reduce invasiveness in patients. The aim of the present review was to identify the methodological problems that hinder widespread use of IDIF in PET brain studies. We conclude that IDIF can be successfully implemented only with a minority of PET tracers. Even in those cases, it only rarely translates into a less-invasive procedure for the patient. Finally, we discuss some possible alternative methods for obtaining less-invasive input function.


Figures
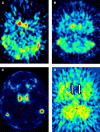
Figure 1
Figure 1
Early summed frames of [11C](R)-rolipram, [18F]-FMPEP-d2, [11C]-N-desmethyl-loperamide, and [11C]-DASB. These four tracers show different biodistributions and carotid/background ratio. [11C](R)-rolipram (A) shows a strong carotid signal, with a relatively low spill-in from the background tissues. Whole-blood time–activity curves could thus be reliably estimated from the images (Zanotti-Fregonara et al, 2011b). In contrast, [18F]-FMPEP-d2 (B) shows a higher spill-in from surrounding regions, probably due to its higher lipophilicity. This spill-in could not be well corrected, and the whole-blood time–activity curves generally showed a low peak and a progressively increasing tail. [11C]-N-desmethyl-loperamide (C) is a substrate for the P-gp efflux protein at the blood–brain barrier. Therefore, the carotid/background ratio is excellent, because there is virtually no background activity. Nevertheless, reliable whole-blood time–activity curves could not be obtained, probably because the images were too noisy and iterative reconstruction algorithms may not quantify ‘cold zones' well (the raw carotid time–activity curves often showed a much higher concentration of activity than the corresponding arterial blood samples). Finally, in [11C]-DASB scans (D), the carotids (indicated with arrows) are curiously almost invisible. Although carotids could be delineated using a coregistered magnetic resonance image (MRI), the signal is too faint to be reliably quantified. The color reproduction of this figure is available at the HTML version of this article.
Figure 2
Figure 2
Representative blood time–activity curves obtained from arterial sampling for [11C](R)-rolipram (left column) and [11C]-PBR28 (right column). The area under the curve of the peak (shaded in blue) is usually difficult to estimate reliably because it is characterized by rapid changes of radioactivity over time, while the area under the curve of the remaining part (the tail, shaded in green) is easier to estimate. [11C](R)-rolipram whole-blood time–activity curves (A) are generally well estimated. In addition, [11C](R)-rolipram is slowly metabolized and even after metabolite correction, the area under the peak is always negligible compared with the total area under the curve (B). [11C]-PBR28 whole-blood time–activity curves (C) are also well estimated. However, because the tail comprises mostly radiometabolites, after metabolite correction the area under the tail dramatically decreases and the unreliable peak now accounts for a larger proportion of the total area under the curve (D). Please note that the SUV concentration of the parent can be higher than that of the whole-blood, because the parent values refer to the concentration in the plasma. The color reproduction of this figure is available at the HTML version of this article.

Similar articles

Cited by

References

    1. Ahn JY, Lee JS, Jang MJ, Lee DS.2000Noninvasive extraction of input function from carotid artery in H2-15O dynamic brain positron emission tomography using independent component analysisSecond International Workshop on Independent Component Analysis and Blind Signal Separation. Proceedings, pp493–497.
    1. Asselin MC, Cunningham VJ, Amano S, Gunn RN, Nahmias C. Parametrically defined cerebral blood vessels as non-invasive blood input functions for brain PET studies. Phys Med Biol. 2004;49:1033–1054. - PubMed
    1. Backes H, Ullrich R, Neumaier B, Kracht L, Wienhard K, Jacobs AH. Noninvasive quantification of (18)F-FLT human brain PET for the assessment of tumour proliferation in patients with high-grade glioma. Eur J Nucl Med Mol Imaging. 2009;36:1960–1967. - PMC - PubMed
    1. Baudrexel A, Graf R, Knoess C, Vollmar S, Wienhard K. Derivation of the input function from dynamic PET images with the HRRT. IEEE Nucl Sci Symp Conf Rec. 2004;6:3890–3892.
    1. Beattie BJ, Smith-Jones PM, Jhanwar YS, Schoder H, Schmidtlein CR, Morris MJ, Zanzonico P, Squire O, Meirelles GS, Finn R, Namavari M, Cai S, Scher HI, Larson SM, Humm JL. Pharmacokinetic assessment of the uptake of 16beta-18F-fluoro-5alpha-dihydrotestosterone (FDHT) in prostate tumors as measured by PET. J Nucl Med. 2010;51:183–192. - PMC - PubMed

Publication types