. 2011 Jul;9(7):e1001106.
doi: 10.1371/journal.pbio.1001106. Epub 2011 Jul 19.

Coupled evolution of transcription and mRNA degradation

Affiliations

Coupled evolution of transcription and mRNA degradation

Mally Dori-Bachash et al. PLoS Biol. 2011 Jul.

Abstract

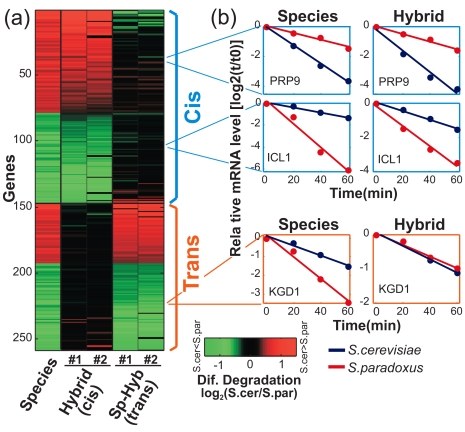
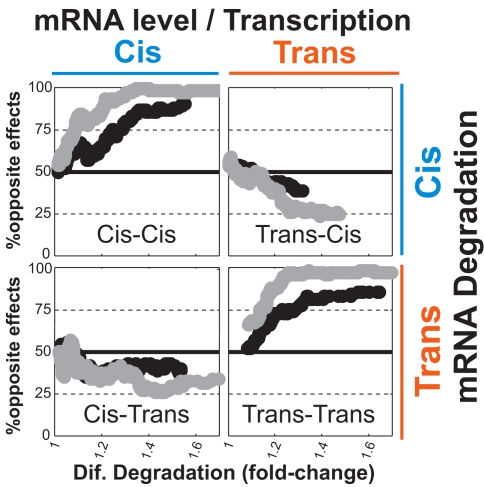
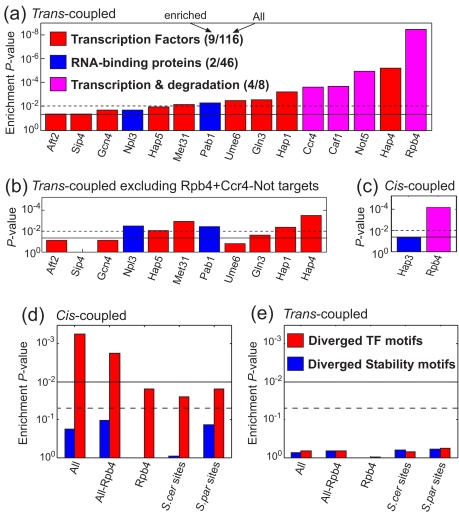
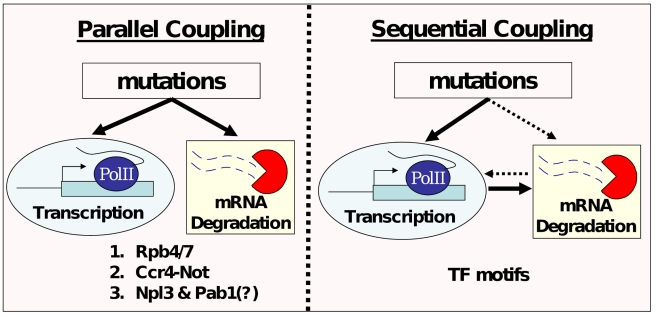
mRNA levels are determined by the balance between transcription and mRNA degradation, and while transcription has been extensively studied, very little is known regarding the regulation of mRNA degradation and its coordination with transcription. Here we examine the evolution of mRNA degradation rates between two closely related yeast species. Surprisingly, we find that around half of the evolutionary changes in mRNA degradation were coupled to transcriptional changes that exert opposite effects on mRNA levels. Analysis of mRNA degradation rates in an interspecific hybrid further suggests that opposite evolutionary changes in transcription and in mRNA degradation are mechanistically coupled and were generated by the same individual mutations. Coupled changes are associated with divergence of two complexes that were previously implicated both in transcription and in mRNA degradation (Rpb4/7 and Ccr4-Not), as well as with sequence divergence of transcription factor binding motifs. These results suggest that an opposite coupling between the regulation of transcription and that of mRNA degradation has shaped the evolution of gene regulation in yeast.


Conflict of interest statement

The authors have declared that no competing interests exist.

Figures

Figure 1
Figure 1. Large-scale analysis of mRNA degradation rates in two yeast species.
(a) R 2 values (goodness-of-fit) for a linear-fit to the log2 mRNA levels at the four time points (see inset for example of a single gene). As control, we performed the same analysis to 10,000 shuffled profiles in which each time-point is taken from a different gene (randomly selected), thus retaining the overall degradation of mRNA levels but shuffling the gene-specific degradation rates. 78% of the real profiles (compared with 18% of the shuffled profiles) obtained an R 2 value above 0.94 and were included in all further analyses. (b) Correlation of S. cerevisiae (blue) and S. paradoxus (red) mRNA degradation rates: (i) between different probes for the same genes (note that different probes typically have different hybridization intensities, yet the mRNA degradation rates are highly reproducible, see Materials and Methods), (ii) between biological repeat experiments, and (iii) between this work and a previous work that used a temperature-sensitive mutation in RNA polymerase II to block transcription. Note that although this previous work analyzed only S. cerevisiae, it has high correlations with our data for the two species. (c) Scatter-plot of mRNA degradation rates in S. cerevisiae and S. paradoxus, which have a genome-wide correlation of 0.78. (d) Patterns of mRNA degradation for the 12 oxidative phosphorylation genes included in the analysis in S. cerevisiae (blue) and S. paradoxus (red).
Figure 2
Figure 2. Coupled evolution of transcription and mRNA degradation.
(a) Sliding window analysis (windows of 200 genes) for the percentage of inter-species differentially expressed genes (above 1.5-fold), using either mRNA levels (black) or estimated transcription rates (gray), as a function of the fold-change of inter-species differences in mRNA degradation rates. Dashed lines indicate the genome-wide percentage of differential mRNA levels (black) or transcription rates (gray). The green section includes small differences in mRNA degradation which may reflect technical variations, while the red section includes larger and biologically meaningful differences in mRNA degradation. (b) Scatter-plot of differential mRNA degradation rates versus differential mRNA levels for genes with (full circles) or without (empty circles) significant difference in mRNA degradation, and for oxidative phosphorylation genes (blue). The number of genes with significant difference in mRNA degradation is shown for each quarter, demonstrating an enrichment of genes with opposite effects of mRNA degradation and mRNA levels (genes with higher degradation in S. cerevisiae also tend to have higher mRNA levels, as the upper-right quarter has more genes than the lower-right quarter). (c) Sliding window analysis (windows of 200 genes) for the percentage of genes with opposite effects of transcription and degradation among those with differential mRNA degradation rate and either differential mRNA levels (black) or differential transcription rate (gray), as a function of the fold-change of inter-species differences in mRNA degradation rates. Dashed line indicates 50% opposite effects, as would be expected by chance if differential expression and differential degradation are independent. Green and red sections are as in (a). (d) Pie charts for the different combinations of differences in transcription and mRNA degradation, among the genes with differential mRNA degradation (right) and the genes with differential transcription (left). The analysis was performed with conservative estimates of coupling (only those with coupling as defined both by analyses of mRNA levels and by analysis of estimated transcription rates), while the percentages in parentheses show the results of a more relaxed analysis, in which either mRNA levels or transcription rates were sufficient to define coupling.
Figure 3
Figure 3. Cis and trans divergence of mRNA degradation.
Classification of inter-species differences in mRNA degradation rates into cis and trans based on the extent of differences observed between the two hybrid alleles (see Materials and Methods). (a) Heatmap of the differences in mRNA degradation rates, log2(S. cer/S. par), between the two species (left column), between the corresponding hybrid alleles (middle columns, reflecting only the cis component), and the subtraction of the species and hybrid differences (right columns, reflecting only the trans component). (b) mRNA degradation profiles of the two species (left) and the corresponding hybrid alleles (right) are shown for two examples of cis-differences (top) and one example of trans-difference (bottom).
Figure 4
Figure 4. Enrichment of opposite effects only for cis-cis and trans-trans combinations supports a mechanistic coupling.
Inter-species differences in mRNA levels (or estimated transcription rates) and mRNA degradation were divided into the contribution of cis- and trans-mutations based on the hybrid data. The enrichment of opposite transcription and degradation effects was examined for each of the four combinations of cis and trans, by a sliding window analysis of the percentage of opposite effects as a function of the fold-changes in mRNA degradation.
Figure 5
Figure 5. Coupling is associated with divergence of Rpb4/7, Ccr4-Not, and TF motifs.
(a) Target-sets of various TFs , RNA-binding proteins , and two complexes implicated in both transcription and degradation (Rbp4/7 and Ccr4-Not [33]) were examined for enrichment with trans-coupled genes. 15 and 10 datasets had significant enrichment below a p value of 0.05 (full line) and 0.01 (dashed line), respectively, and these are shown in order of statistical significance. The total numbers of analyzed datasets and those with significant enrichments are shown in parentheses. (b) Same as in (a) after excluding targets of Rpb4, Ccr4, and Not5. (c) Same as in (a) for enrichment with cis-coupled genes. (d) Diverged TF binding (red) or mRNA stability (blue) motifs, which are intact only in S. cerevisiae (S. cer sites) or only in S. paradoxus (S. par sites), were identified by sequence analysis. The enrichment of diverged motifs (for all TFs combined or all stability motifs combined) was examined among all cis-coupled genes (All), cis-coupled genes predicted to be targets (Rpb4) or non-targets (All-Rpb4) of Rpb4, and for cis-coupled S. cer sites or cis-coupled S. par sites. (e) Same as (d) for enrichment with trans-coupled genes.
Figure 6
Figure 6. Two models of mechanistic coupling whereby individual mutations affect both transcription and mRNA degradation.
The first model (Parallel coupling, left) assumes mutations in a single trans-factor that influences both processes and is consistent with the enrichment of trans-coupled genes with targets of Rpb4, Ccr4-Not, Pab1, and Npl3. The second model (Sequential coupling, right) assumes mutations that exert transcriptional effects (either in cis or in trans) and that these transcriptional effects then induce changes in mRNA degradation, for example, through a shuttling mechanism whereby Rpb4/7 (or other transcription-related molecules) binds to the mRNA co-transcriptionally and transports with it to the cytoplasm. This model is consistent with the enrichment of diverged TF motifs among cis-coupled genes. An opposite sequential coupling is also possible (dashed arrows), whereby mutations affect mRNA degradation and this effect then induces transcriptional changes, yet we do not find evidence to support it.

References

    1. Cheadle C, Fan J, Cho-Chung Y. S, Werner T, Ray J, et al. Control of gene expression during T cell activation: alternate regulation of mRNA transcription and mRNA stability. BMC Genomics. 2005;6:75. - PMC - PubMed
    1. Garneau N. L, Wilusz J, Wilusz C. J. The highways and byways of mRNA decay. Nat Rev Mol Cell Biol. 2007;8:113–126. - PubMed
    1. Wang Y, Liu C. L, Storey J. D, Tibshirani R. J, Herschlag D, et al. Precision and functional specificity in mRNA decay. Proc Natl Acad Sci U S A. 2002;99:5860–5865. - PMC - PubMed
    1. Elkon R, Zlotorynski E, Zeller K. I, Agami R. Major role for mRNA stability in shaping the kinetics of gene induction. BMC Genomics. 2010;11:259. - PMC - PubMed
    1. Molin C, Jauhiainen A, Warringer J, Nerman O, Sunnerhagen P. mRNA stability changes precede changes in steady-state mRNA amounts during hyperosmotic stress. RNA. 2009;15:600–614. - PMC - PubMed

Publication types

MeSH terms