. 2011 Jul;7(7):e1002158.
doi: 10.1371/journal.ppat.1002158. Epub 2011 Jul 21.

Selection of resistant bacteria at very low antibiotic concentrations

Affiliations

Selection of resistant bacteria at very low antibiotic concentrations

Erik Gullberg et al. PLoS Pathog. 2011 Jul.

Abstract

The widespread use of antibiotics is selecting for a variety of resistance mechanisms that seriously challenge our ability to treat bacterial infections. Resistant bacteria can be selected at the high concentrations of antibiotics used therapeutically, but what role the much lower antibiotic concentrations present in many environments plays in selection remains largely unclear. Here we show using highly sensitive competition experiments that selection of resistant bacteria occurs at extremely low antibiotic concentrations. Thus, for three clinically important antibiotics, drug concentrations up to several hundred-fold below the minimal inhibitory concentration of susceptible bacteria could enrich for resistant bacteria, even when present at a very low initial fraction. We also show that de novo mutants can be selected at sub-MIC concentrations of antibiotics, and we provide a mathematical model predicting how rapidly such mutants would take over in a susceptible population. These results add another dimension to the evolution of resistance and suggest that the low antibiotic concentrations found in many natural environments are important for enrichment and maintenance of resistance in bacterial populations.


Conflict of interest statement

The authors have declared that no competing interests exist.

Figures
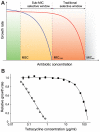
Figure 1
Figure 1. Growth rates as a function of antibiotic concentration.
(A) Schematic representation of growth rates as a function of antibiotic concentration. Green indicates a concentration interval where the susceptible strain (blue line) will outcompete the resistant strain (red line). Orange (sub-MIC selective window) and red (traditional mutant selective window) indicate concentration intervals where the resistant strain will outcompete the susceptible strain. MICsusc =  minimal inhibitory concentration of the susceptible strain, MICres =  minimal inhibitory concentration of the resistant strain and MSC =  minimal selective concentration. (B). Relative exponential growth rates of susceptible (open circles) and resistant (closed circles) strains of S. typhimurium as a function of tetracycline concentration. Standard errors of the mean are indicated. A relative growth rate of 1.0 corresponds to approximately 1.8 hr−1. Cells were grown in Mueller Hinton medium at 37°C.
Figure 2
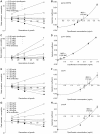
Figure 2. Competition experiments between susceptible and resistant strains, streptomycin and tetracycline.
Competition experiments at different concentrations of antibiotics (A (rpsL105 (K42R)) and C (Tn10dtet), and calculated selection coefficients as a function of antibiotic concentrations (B and D). Fig. A and C are each based on one single competition experiment (averages of four competitions), while Fig. B and D are calculated from the selection coefficients of up to 20 competitions (Table S3 in Text S1). Standard errors of the mean are indicated.
Figure 3
Figure 3. Competition experiments between susceptible and resistant strains, ciprofloxacin.
Competition experiments at different concentrations of ciprofloxacin (A (gyrA2 (D87N)), C (gyrA1 (S83L)), E (ΔacrR) and G (ΔmarR)) and calculated selection coefficients as a function of antibiotic concentrations (B, D, F and H). Fig. A, C, E and G are each based on one single competition experiment (averages of three competitions), while fig. B, D, F and H are calculated from the selection coefficients of 6 competitions (Table S3 in Text S1). Standard errors of the mean are indicated.
Figure 4
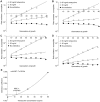
Figure 4. Competition experiments with low initial frequencies of resistant mutants.
Competition experiments at different concentrations of antibiotics and different starting fractions of resistant mutants. (A) Initial ratio of susceptible to resistant mutants 10∶1. (B) Initial ratio of susceptible to resistant mutants 102∶1. (C) Initial ratio of susceptible to resistant mutants 103∶1. (D) Initial ratio of susceptible to resistant mutants 104∶1. (E) Calculated selection coefficients as a function of antibiotic concentrations. Fig. A to D are each based on one single competition experiment while E is calculated from the selection coefficients of 24 independent competitions with four different starting fractions of resistant mutants (Table S3 in Text S1). Standard errors of the mean are indicated.
Figure 5
Figure 5. Selection of de novo resistant mutants at sub-inhibitory concentrations of antibiotics.
A total of 20 independent lineages of S. typhimurium were serially passaged in Mueller-Hinton medium containing 1 µg/ml streptomycin. Every 100 generations approximately 105 cells were plated onto LB agar containing different concentrations of streptomycin and the fractions of resistant mutants were calculated. The data points are grouped by number of generations of growth and resistance level, and in each of these data sets one data point represents the fraction of cells present in one lineage capable of growth at the specified antibiotic concentrations. Please note that data points at the baseline will overlap.
Figure 6
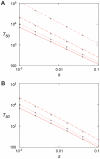
Figure 6. Fixation time for adaptive mutations.
(A) 50% penetration time as function of selection coefficient when no mutants are present initially for N = 107 and, from top to bottom, u = 10−9, 10−8, 10−7, and 10−6. Red lines are from Eq. (4) and the crosses from the stochastic model, Eqs. (7) – (10), with m 0  = 0. (B). 50% penetration time as function of the selection coefficient when the initial presence of mutants is determined by mutation-selection balance, m 0  =  Nf 0  =  uN/|s 0|. Results are for s 0  =  −0.02, N = 107 and, from top to bottom, u = 10−6, 10−7, 10−8. The red lines are from Eq. (6), and the crosses are from the stochastic model, Eqs. (7) – (10).

Comment in

Similar articles

Cited by

References

    1. Rice LB. The clinical consequences of antimicrobial resistance. Curr Opin Microbiol. 2009;12:476–481. - PubMed
    1. Witte W. Medical consequences of antibiotic use in agriculture. Science. 1998;279:996–997. - PubMed
    1. Aarestrup FM. Veterinary drug usage and antimicrobial resistance in bacteria of animal origin. Basic Clin Pharmacol. 2005;96:271–281. - PubMed
    1. Martinez JL. Antibiotics and antibiotic resistance genes in natural environments. Science. 2008;321:365–367. - PubMed
    1. Ferber D. Superbugs on the hoof? Science. 2000;288:792–794. - PubMed

Publication types

MeSH terms

Substances