. 2011;6(7):e22544.
doi: 10.1371/journal.pone.0022544. Epub 2011 Jul 21.

Integrated expression profiling and genome-wide analysis of ChREBP targets reveals the dual role for ChREBP in glucose-regulated gene expression

Affiliations

Integrated expression profiling and genome-wide analysis of ChREBP targets reveals the dual role for ChREBP in glucose-regulated gene expression

Yun-Seung Jeong et al. PLoS One. 2011.

Abstract

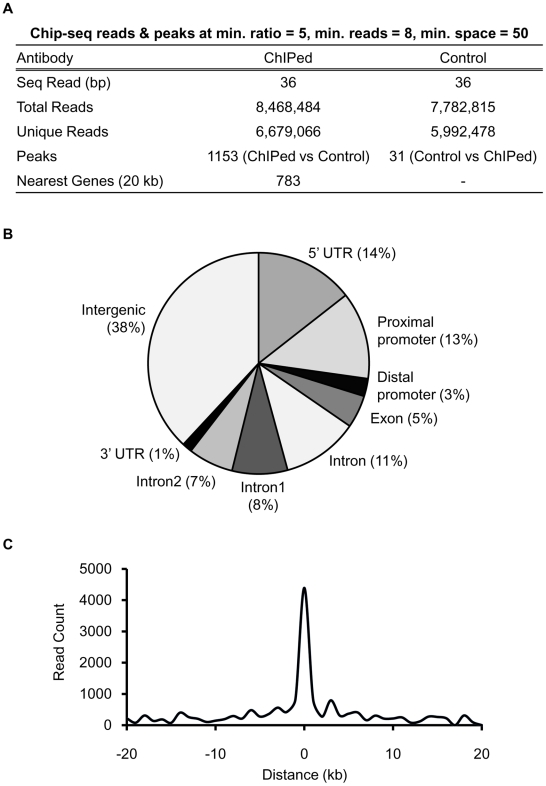
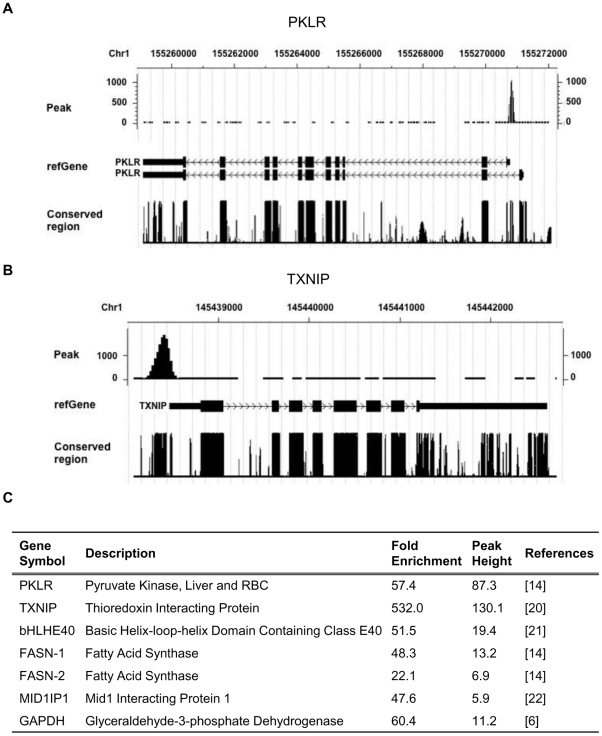
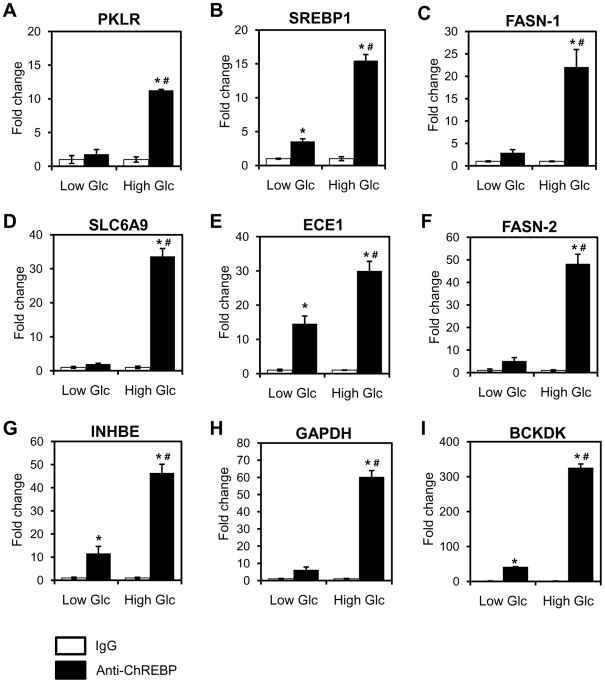
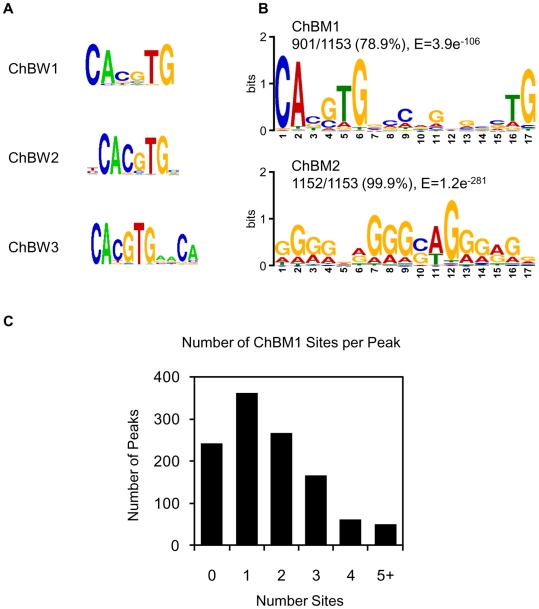
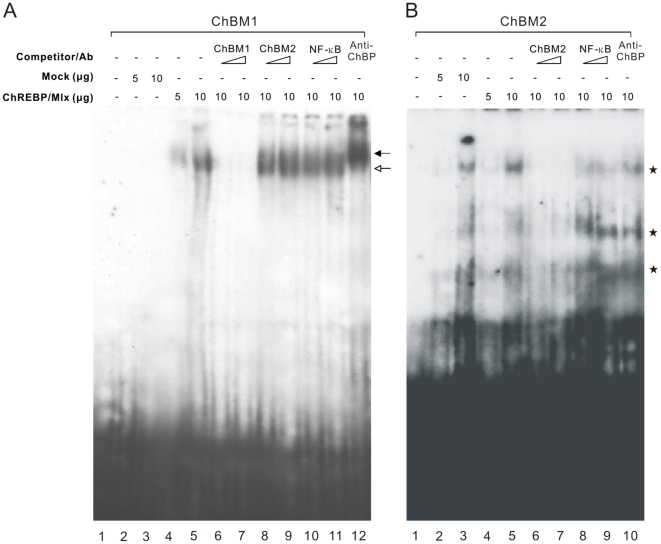
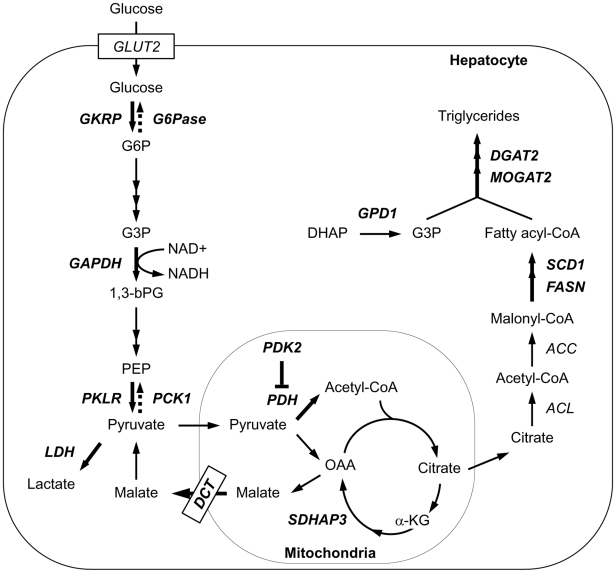
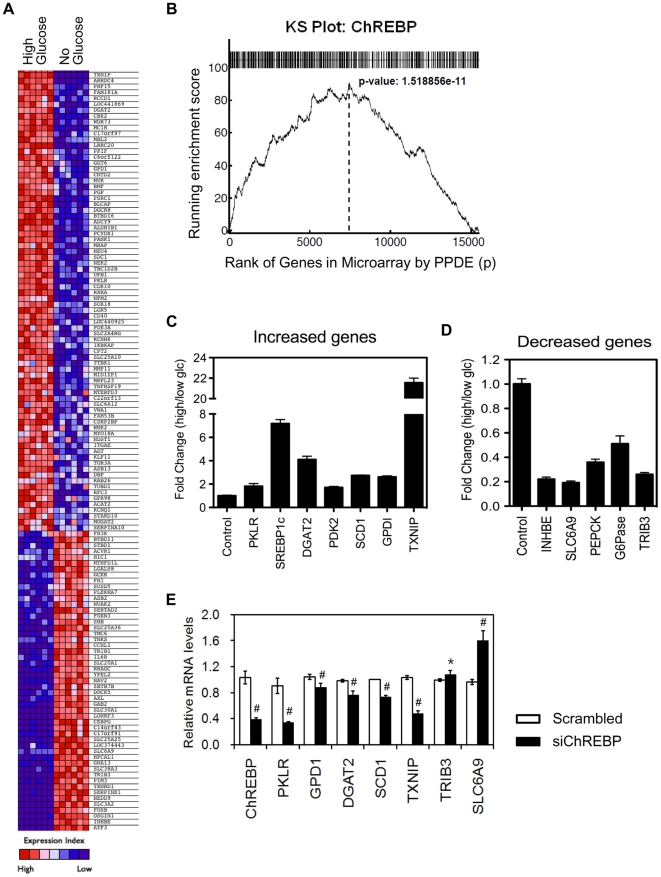
The carbohydrate response element binding protein (ChREBP), a basic helix-loop-helix/leucine zipper transcription factor, plays a critical role in the control of lipogenesis in the liver. To identify the direct targets of ChREBP on a genome-wide scale and provide more insight into the mechanism by which ChREBP regulates glucose-responsive gene expression, we performed chromatin immunoprecipitation-sequencing and gene expression analysis. We identified 1153 ChREBP binding sites and 783 target genes using the chromatin from HepG2, a human hepatocellular carcinoma cell line. A motif search revealed a refined consensus sequence (CABGTG-nnCnG-nGnSTG) to better represent critical elements of a functional ChREBP binding sequence. Gene ontology analysis shows that ChREBP target genes are particularly associated with lipid, fatty acid and steroid metabolism. In addition, other functional gene clusters related to transport, development and cell motility are significantly enriched. Gene set enrichment analysis reveals that ChREBP target genes are highly correlated with genes regulated by high glucose, providing a functional relevance to the genome-wide binding study. Furthermore, we have demonstrated that ChREBP may function as a transcriptional repressor as well as an activator.


Conflict of interest statement

Competing Interests: The authors have declared that no competing interests exist.

Figures

Figure 1
Figure 1. ChIP-seq analysis for ChREBP–DNA binding in human liver cells, HepG2.
(A) Summary of peak analysis. (B) Location of ChREBP binding peaks relative to known genes. The proximal and distal promoters are defined as 2 kb and 5 kb of 5′-flanking DNA, respectively. The majority of sites (38%) are located within an intergenic region; 16% are located in promoter regions. (C) Peak distance relative to TSS of the closest gene. Negative distances indicate regions upstream of TSSs; positive distances indicate regions downstream of TSSs. Note that only the region around the TSS is shown.
Figure 2
Figure 2. Characterization of ChREBP binding sites at selected gene loci.
(A, B) CisGenome Browser screenshots of peaks associated with the PKLR and TXNIP genes. The y-axis shows the number of mapped tags. Annotations are from the UCSC Genome Browser. (C) Seven ChREBP binding sites in six target genes showing peak height and fold enrichment. ChIP-qPCR was performed to confirm the identified ChREBP binding sites. The fold enrichment is the fold increase for the signal from ChREBP ChIPed DNA relative to control IgG. Cyclophilin (Cyclo) and PKLR-4 kb were used as negative controls (0.98- and 1.2-fold enrichment, respectively).
Figure 3
Figure 3. Effects of glucose on ChREBP binding.
HepG2 cells were treated with low (2.7 mM) and high (25 mM) glucose for 8 h. Chromatin was isolated and fragmented, and ChIP was performed with control IgG or anti-ChREBP antibody. Validated primers for each gene were used for quantitative real-time PCR. The data presented as fold increase for the signal from anti-ChREBP relative to control IgG. The negative control, Cyclo, showed no enrichment (data not shown). Values represent the mean ± S.D. of three independent samples. *p<0.005 vs. IgG, #p<0.0001 vs. 2.7 mM glucose with anti-ChREBP.
Figure 4
Figure 4. Enriched motifs in ChREBP binding sites in human liver DNA.
The 1153 peak regions were analyzed for overrepresented motifs using W-ChIPMotifs (A) and MEME (B). The three and two top-scoring motifs from each analysis are shown. (C) Number of ChBM1 motifs in a peak identified by ChIP-seq (p<0.001).
Figure 5
Figure 5. Validation of ChREBP/Mlx binding to two enriched motifs, ChBM1 and ChBM2.
Electrophoretic mobility shift assays were performed with an oligonucleotide containing the ChBM1 (A) or ChBM2 (B) probe. All lanes contain the labeled probe, and lanes 2–12 contain 5 or 10 µg of HEK293 nuclear extract. Lanes 2 and 3 are HEK293 mock-transfected nuclear extract. The other lanes contain extract from HEK293 cells transfected with the ChREBP and Mlx expression plasmids. For competition assays, a 10- or 50-molar excess of various unlabeled competitor DNAs was added to the reaction mixture. Anti-ChREBP (Anti-ChBP, 0.6 µg) was added as indicated. The white arrow indicates the position of the ChREBP/Mlx complex. The black arrow indicates the position of the antibody-supershifted complexes. The asterisks indicate the position of background bands present in the control HEK293 cell nuclear extract.
Figure 6
Figure 6. Genes identified as ChREBP targets in De novo lipogenesis pathway.
A schematic of the de novo lipogenesis pathway is shown. Direct targets of ChREBP identified by ChIP-seq are indicated in boldface type. GKRP, glucokinase regulatory protein; G6Pase, glucose-6-phosphatase, catalytic subunit; GAPDH, glyceraldehyde-3-phosphate dehydrogenase; PKLR, pyruvate kinase, liver and RBC; PCK1, phosphoenolpyruvate carboxykinase1; LDH, lactate dehydrogenase A; DCT, dicarboxylate transporter; PDK2, pyruvate dehydrogenase kinase isozyme2; PDH, pyruvate dehydrogenase; SDHAP3, succinate dehydrogenase complex, subunit A; FASN, fatty acid synthase; SCD1, stearoyl-CoA desaturase 1; GPD1, glycerol-3-phosphate dehydrogenase 1 (soluble); MOGAT2, monoacylglycerol O-acyltransferase 2; DGAT2, diacylglycerol O-acyltransferase homolog 2.
Figure 7
Figure 7. Correlation of ChREBP binding with gene expression.
(A) Heat map view of a sample of ChREBP target genes exhibiting greater than two-fold expression changes in the high glucose state. (B) KS plot. The ChIP-seq peaks were analyzed for their representation within an expression array dataset from no vs. high glucose-treated HepG2 cells as described in the text. All genes in the microarray were ranked by posterior probability of differential expression (PPDE) on the x-axis and the graph plots by the running enrichment score. (C, D) Experimental validation of microarray results of 12 selected ChREBP target genes. HepG2 cells were incubated under 2.7 mM glucose conditions for 16 h. Cells were then either kept in 0 or 25 mM glucose medium for 8 h and harvested for RNA preparation. The levels of target genes were determined by qRT-PCR. Expression levels were normalized to expression of cyclophilin and mRNA levels in no glucose treated cells were set to 1. Values represent the mean of triplicate samples ± S.D. (E) Effects of ChREBP gene silencing on the expression of ChREBP target genes. HepG2 cells were transfected with 20 nmol of either ChREBP siRNA or scrambled siRNA and incubated for 40 h in 2.7 mM DMEM. Then the cells were cultured in 25 mM glucose. After 8 h, total RNA was extracted and analyzed for the expression of ChREBP target genes by qRT-PCR. Data represent the mean ± S.D. of three independent transfections.

References

    1. Yamashita H, Takenoshita M, Sakurai M, Bruick RK, Henzel WJ, et al. A glucose-responsive transcription factor that regulates carbohydrate metabolism in the liver. Proc Natl Acad Sci U S A. 2001;98:9116–9121. - PMC - PubMed
    1. Cairo S, Merla G, Urbinati F, Ballabio A, Reymond A. WBSCR14, a gene mapping to the Williams–Beuren syndrome deleted region, is a new member of the Mlx transcription factor network. Hum Mol Genet. 2001;10:617–627. - PubMed
    1. Kawaguchi T, Takenoshita M, Kabashima T, Uyeda K. Glucose and cAMP regulate the L-type pyruvate kinase gene by phosphorylation/dephosphorylation of the carbohydrate response element binding protein. Proc Natl Acad Sci U S A. 2001;98:13710–13715. - PMC - PubMed
    1. Shih H-M, Liu Z, Towle HC. Two CACGTG motifs with proper spacing dictate the carbohydrate regulation of hepatic gene transcription. J Biol Chem. 1995;270:21991–21997. - PubMed
    1. Stoeckman AK, Ma L, Towle HC. Mlx is the functional heteromeric partner of the carbohydrate response element-binding protein in glucose regulation of lipogenic enzyme genes. J Biol Chem. 2004;279:15662–15669. - PubMed

Publication types

MeSH terms