. 2011 Jul;5(7):e1245.
doi: 10.1371/journal.pntd.0001245. Epub 2011 Jul 19.

Emergence of a globally dominant IncHI1 plasmid type associated with multiple drug resistant typhoid

Affiliations

Emergence of a globally dominant IncHI1 plasmid type associated with multiple drug resistant typhoid

Kathryn E Holt et al. PLoS Negl Trop Dis. 2011 Jul.

Abstract

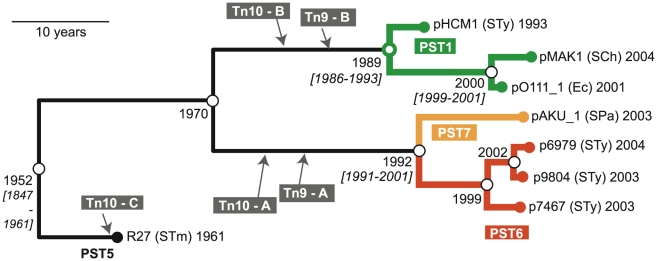
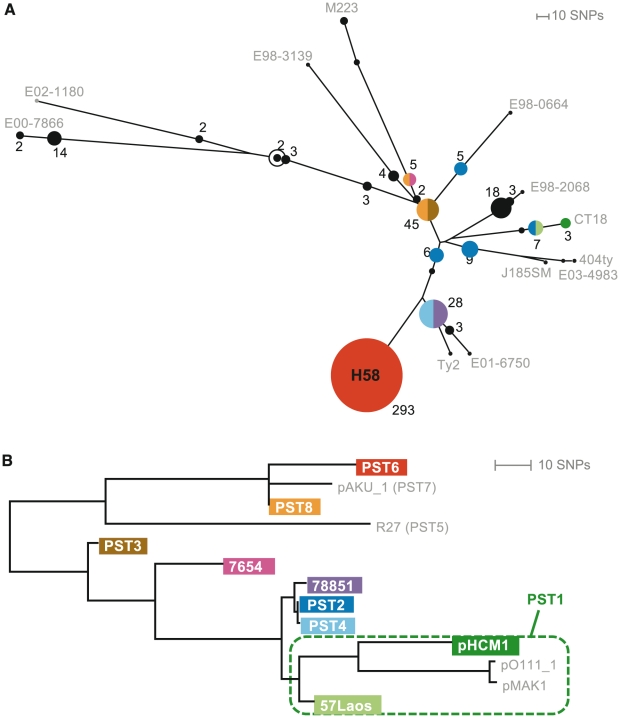
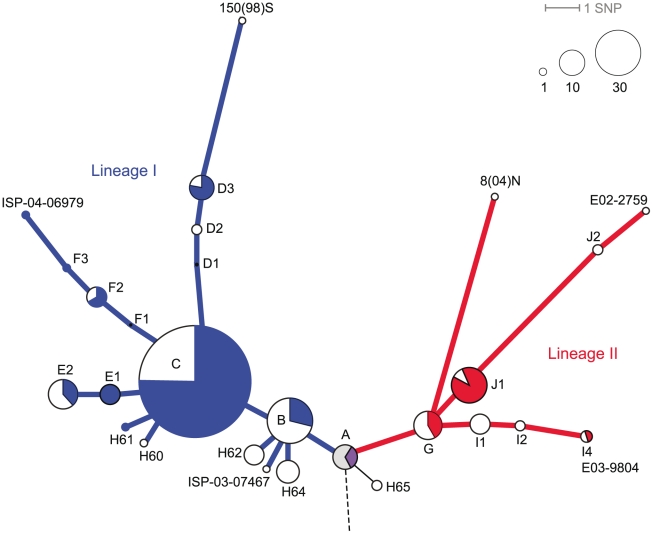
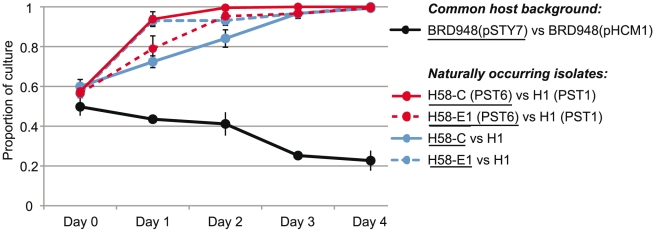
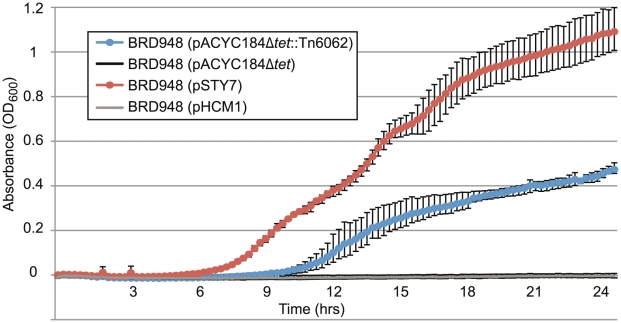
Typhoid fever, caused by Salmonella enterica serovar Typhi (S. Typhi), remains a serious global health concern. Since their emergence in the mid-1970s multi-drug resistant (MDR) S. Typhi now dominate drug sensitive equivalents in many regions. MDR in S. Typhi is almost exclusively conferred by self-transmissible IncHI1 plasmids carrying a suite of antimicrobial resistance genes. We identified over 300 single nucleotide polymorphisms (SNPs) within conserved regions of the IncHI1 plasmid, and genotyped both plasmid and chromosomal SNPs in over 450 S. Typhi dating back to 1958. Prior to 1995, a variety of IncHI1 plasmid types were detected in distinct S. Typhi haplotypes. Highly similar plasmids were detected in co-circulating S. Typhi haplotypes, indicative of plasmid transfer. In contrast, from 1995 onwards, 98% of MDR S. Typhi were plasmid sequence type 6 (PST6) and S. Typhi haplotype H58, indicating recent global spread of a dominant MDR clone. To investigate whether PST6 conferred a selective advantage compared to other IncHI1 plasmids, we used a phenotyping array to compare the impact of IncHI1 PST6 and PST1 plasmids in a common S. Typhi host. The PST6 plasmid conferred the ability to grow in high salt medium (4.7% NaCl), which we demonstrate is due to the presence in PST6 of the Tn6062 transposon encoding BetU.


Conflict of interest statement

The authors have declared that no competing interests exist.

Figures

Figure 1
Figure 1. Phylogenetic tree for IncHI1 plasmid sequences.
Phylogenetic tree based on 347 SNPs identified among 8 publicly available IncHI1 plasmid sequences (Table 2), constructed using BEAST (with 20 million iterations, 4 replicate runs, exponential clock model). Terminal nodes are labelled with the organism of origin (STy  =  Salmonella enterica serovar Typhi, SCh  =  Salmonella enterica serovar Choleraesuis, STm  =  Salmonella enterica serovar Typhimurium, SPa  =  Salmonella enterica serovar Paratyphi A, Ec  =  E. coli O111:H-) and date of isolation. Isolation dates were input into the BEAST model in order to estimate divergence dates for internal nodes (open circles, labelled with divergence date estimates; brackets indicate 95% highest posterior density interval). Insertion sites (grey) are based on sequence data and verified (except for pO111_1 and pMAK1) by PCR. Precise insertion sites and PCR primers for verification are given in Tables 3 & 4. Four major plasmid groups, PST1, PST5, PST6, PST7, are coloured as labelled.
Figure 2
Figure 2. Distribution of IncHI1 loci among S. Typhi isolates.
X-axis indicates the number of IncHI1 plasmid loci (out of 231 targets) generating a fluorescent signal in the Illumina GoldenGate SNP assay. Isolates clearly fall into two groups: either >90% of IncHI1 target loci were detected, taken to imply presence of an IncHI1 plasmid (red), or <10% of IncHI1 target loci were detected, taken to imply absence of any IncHI1 plasmid (blue).
Figure 3
Figure 3. Phylogenetic trees of S. Typhi chromosome and IncHI1 plasmid.
(A) Phylogenetic tree indicating chromosomal haplotypes of 454 S. Typhi isolates determined by SNP typing with the GoldenGate assay. Circles correspond to detected S. Typhi haplotypes; node sizes are scaled to the number of isolates detected with that haplotype and labelled with this number. Unfilled circle indicates tree root; reference isolates used to define the S. Typhi SNPs are labelled with the isolate name. S. Typhi haplotypes in which IncHI1 plasmids were detected (N = 201) are coloured; black circles indicate no IncHI1 plasmids were found among S. Typhi of that haplotype; other colours indicate the presence of specific IncHI1 plasmid haplotypes corresponding to the colours in (B). Note that most of the coloured nodes also contain S. Typhi isolates with no plasmid, and the colours do not represent the proportion of isolates harbouring the various plasmid types. (B) Phylogenetic tree of IncHI1 plasmids determined by SNP typing with the GoldenGate assay (coloured leaf nodes); grey leaf nodes indicate the position of non-S. Typhi plasmids, as determined from plasmid sequence data listed in Table 2.
Figure 4
Figure 4. Phylogenetic tree of the H58 haplogroup of S. Typhi.
Dashed line indicates where this tree joins into the larger phylogenetic tree of S. Typhi (shown in Figure 3A). The two major H58 lineages are indicated by colour (blue, lineage I; red, lineage II; purple, common ancestor of both lineages). Nodes are labelled with isolate names (outer nodes representing sequenced isolates; see [45]), haplotype (H followed by number, as defined in [41]) or letters indicating nodes resolved by SNP typing. Node sizes indicate the relative frequency of each haplotype within the study collection of 269 H58 S. Typhi isolates, according to the scale provided. The proportion of isolates in each node carrying the PST6 plasmid and IS1 (solid colour), IS1 only (white) or neither (grey) is indicated by shading.
Figure 5
Figure 5. Competitive growth assays for S. Typhi H58 and H1 with and without IncHI1 plasmids.
The dynamics of five competitive growth assays conducted over four days of sequential sub-culture. Black line indicates competition in a common host background (attenuated laboratory strain S. Typhi BRD948; haplotype H10); the proportion of PST1- and PST6-bearing bacteria at each time point was calculated by streaking an aliquot of the sample onto agar plates and testing random colonies using a PCR that differentiates PST1 and PST6. Coloured lines indicate competition between wildtype S. Typhi isolates as specified in the legend (see Table S1 for isolate names); the proportion of H58 and H1 chromosomes at each time point was calculated by quantifying the relative abundance of two alleles at a SNP locus that differs between H58 and H1 S. Typhi using quantitative PCR. For all assays, experiments were replicated at least three times; data points represent the mean proportion of culture corresponding to the isolate underlined in the legend; error bars show the standard deviation of this proportion.
Figure 6
Figure 6. The effect of Tn6062 on osmotolerance in S. Typhi BRD948.
Growth curves for S. Typhi isolates in 0.8 M NaCl LB broth. Error bars indicate range of maximum and minimum values.

References

    1. Kothari A, Pruthi A, Chugh TD. The burden of enteric fever. J Infect Dev Ctries. 2008;2:253–259. - PubMed
    1. Crump JA, Luby SP, Mintz ED. The global burden of typhoid fever. Bull World Health Organ. 2004;82:346–353. - PMC - PubMed
    1. World Health Organization. Communicable Disease Surveillance and Response Vaccine and Biologicals; 2003. The diagnosis, treatment and prevention of typhoid fever. pp. 7–18.
    1. Whitaker JA, Franco-Paredes C, del Rio C, Edupuganti S. Rethinking typhoid fever vaccines: implications for travelers and people living in highly endemic areas. J Travel Med. 2009;16:46–52. - PubMed
    1. Ochiai RL, Acosta CJ, Agtini M, Bhattacharya SK, Bhutta ZA, et al. The use of typhoid vaccines in Asia: the DOMI experience. Clin Infect Dis. 2007;45(Suppl 1):S34–38. - PubMed

Publication types

MeSH terms