. 2011 Aug 3:4:14.
doi: 10.1186/1756-8935-4-14.

Allele-specific transcriptional elongation regulates monoallelic expression of the IGF2BP1 gene

Affiliations

Allele-specific transcriptional elongation regulates monoallelic expression of the IGF2BP1 gene

Brandon J Thomas et al. Epigenetics Chromatin. .

Abstract

Background: Random monoallelic expression contributes to phenotypic variation of cells and organisms. However, the epigenetic mechanisms by which individual alleles are randomly selected for expression are not known. Taking cues from chromatin signatures at imprinted gene loci such as the insulin-like growth factor 2 gene 2 (IGF2), we evaluated the contribution of CTCF, a zinc finger protein required for parent-of-origin-specific expression of the IGF2 gene, as well as a role for allele-specific association with DNA methylation, histone modification and RNA polymerase II.

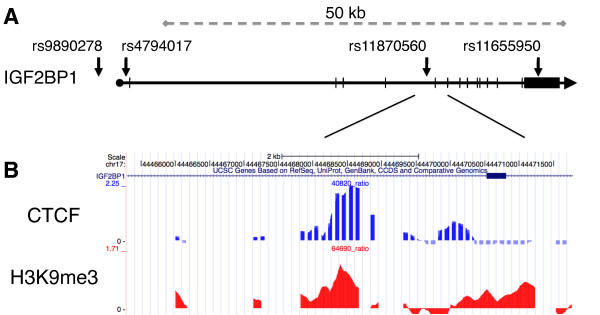
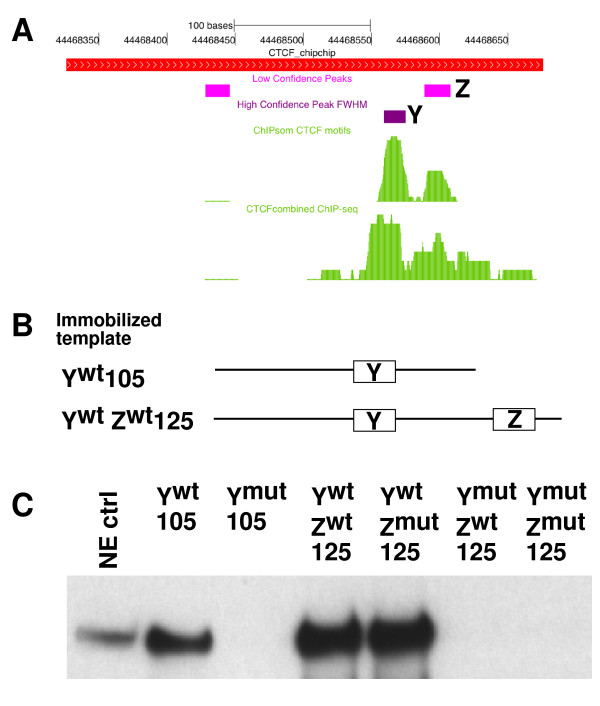
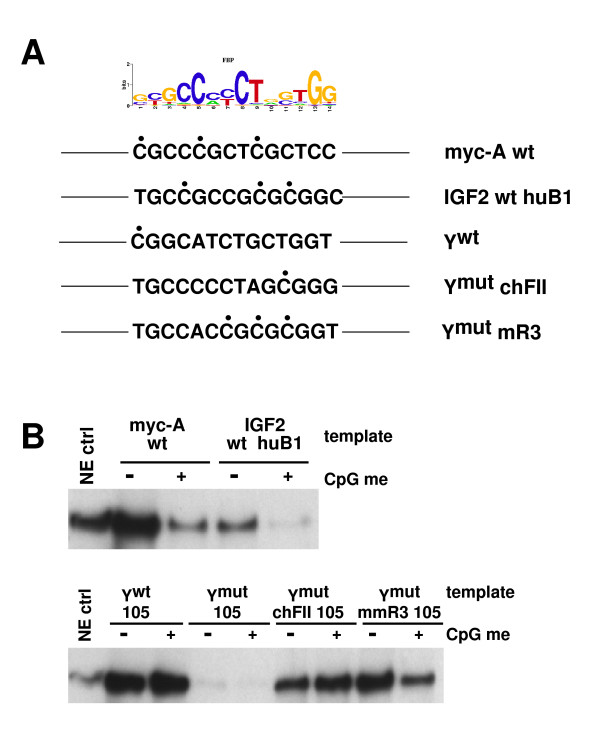
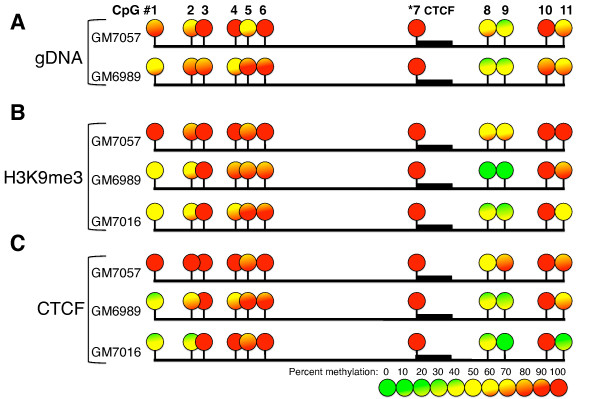
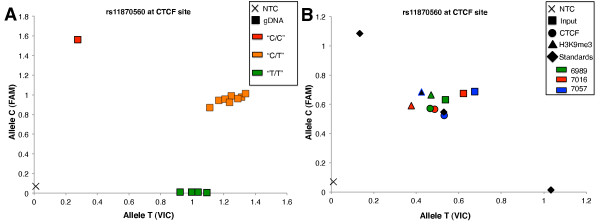
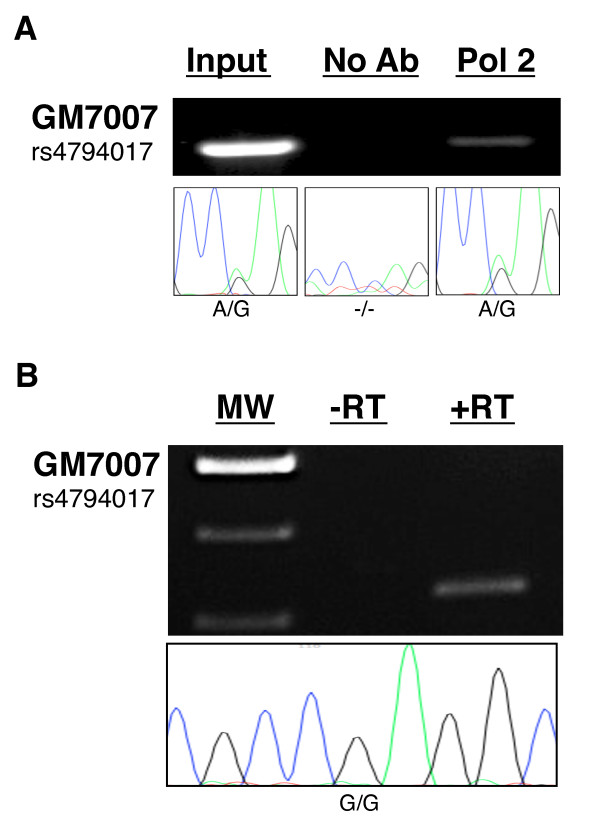
Results: Using array-based chromatin immunoprecipitation, we identified 293 genomic loci that are associated with both CTCF and histone H3 trimethylated at lysine 9 (H3K9me3). A comparison of their genomic positions with those of previously published monoallelically expressed genes revealed no significant overlap between allele-specifically expressed genes and colocalized CTCF/H3K9me3. To analyze the contributions of CTCF and H3K9me3 to gene regulation in more detail, we focused on the monoallelically expressed IGF2BP1 gene. In vitro binding assays using the CTCF target motif at the IGF2BP1 gene, as well as allele-specific analysis of cytosine methylation and CTCF binding, revealed that CTCF does not regulate mono- or biallelic IGF2BP1 expression. Surprisingly, we found that RNA polymerase II is detected on both the maternal and paternal alleles in B lymphoblasts that express IGF2BP1 primarily from one allele. Thus, allele-specific control of RNA polymerase II elongation regulates the allelic bias of IGF2BP1 gene expression.

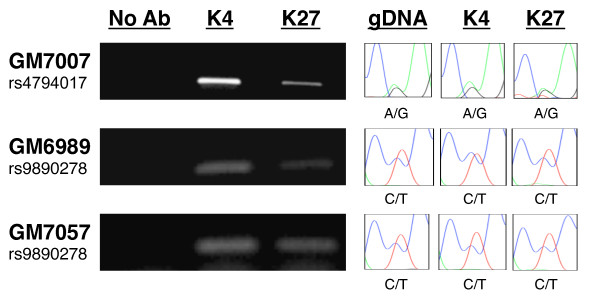
Conclusions: Colocalization of CTCF and H3K9me3 does not represent a reliable chromatin signature indicative of monoallelic expression. Moreover, association of individual alleles with both active (H3K4me3) and silent (H3K27me3) chromatin modifications (allelic bivalent chromatin) or with RNA polymerase II also fails to identify monoallelically expressed gene loci. The selection of individual alleles for expression occurs in part during transcription elongation.


Figures

Figure 1
Figure 1
Colocalization of CTCF and H3K9me3 at the IGF2BP1 locus. Array-based chromatin immunoprecipitation (ChIP-chip) data for both CTCF and histone H3 trimethylated at lysine 9 (H3K9me3) identify candidate loci for analysis of monoallelic expression. (A) Depiction of the IGF2BP1 gene with specific SNPs examined in this study (arrows). (B) Close-up portion of the locus with tracks for CTCF enrichment (top track) and H3K9me3 association (bottom track) near SNP site rs11870560. The ChIP-chip data are displayed using the UCSC Genome Browser. DNA derived from CTCF ChIP experiments was analyzed by using microarrays with hybridization probes spaced 100 bp apart. The higher resolution of the H3K9me3 ChIP-chip data is due to the use of condensed array sets that tiled through all of the CTCF-positive regions with probes overlapping each other by 12 nt.
Figure 2
Figure 2
Analysis of allele-specific IGF2BP1 expression. Comparative analysis of sequence variations in B lymphoblasts of the CEPH pedigree family 1331 reveals monoallelic expression of the IGF2BP1 gene. (A) Pedigree analysis was carried out for the SNP site rs11655950 located in the 3'-UTR of the IGF2BP1 gene. Each individual is shown with CEPH family identification, sample identification and genetic information (SNP genomic DNA (gDNA) genotype- or transcript-derived genotype). Individuals with monoallelic IGF2BP1 gene expression are indicated by asterisks. If the individual is homozygous at the SNP, allele-specific expression cannot be defined. (B) Left: Genotyping results at rs11655950 with gDNA from members of CEPH family 1331. gDNA was analyzed using the TaqMan SNP Genotyping Assay. This assay discriminates between sequence variants using two allele-specific probes carrying two different fluorophores, VIC and FAM. Individuals coded in red and green represent cell lines that are homozygous for alleles A and G, respectively. Orange-labeled individuals contain both A and G alleles at SNP rs11655950 and represent informative cell lines used for further analysis of monoallelic expression. Diamonds indicate cDNA samples, and black × indicates averaged triplicates of a no-template control (NTC) near the origin of the graph. Right: Genotyping results of transcript-derived cDNA from heterozygous B lymphoblasts. Individuals are color-coded in the figure key. No-RT controls (No RT) from cDNA synthesis are shown near the origin of the graph and are indicated by a black X. Control samples (standards) of stem cell lines previously genotyped as homozygous AA, heterozygous AG and homozygous GG were plotted and are indicated by diamonds.
Figure 3
Figure 3
Functional CTCF sequence motifs at the intronic region of the IGF2BP1 gene. (A) UCSC Genome Browser display of relative positions of high- and low-confidence CTCF target motifs, ChIP-chip, ChIP sequencing (ChIP-seq) and ChIP self-organizing maps results. (B) Ywt 105-bp and YwtZwt 125-bp templates employed in the immobilized template assay. Detailed sequences of the templates are shown in Figure S9 in Additional file 2. (C) Western blot analysis of CTCF recruitment to Ywt 105-bp and YwtZwt 125-bp templates containing combinations of wild-type and mutated CTCF target sequences. Motif Y is sufficient for recruitment of CTCF.
Figure 4
Figure 4
Cytosine methylation of the CTCF core motif Y does not influence binding of CTCF. (A) CTCF motifs used in the context of the 105-bp immobilized template derived from the intronic region of the IGF2BP1 gene are shown. The position frequency matrix of the CTCF target motif is shown at the top. Only the sense strand of the motifs is shown. CpG residues are indicated by filled black circles. Myc-A, IGF2 huB1 and Ywt are CTCF target sequences derived from MYC, IGF2 and IGF2BP1 gene loci. Ymut chFII and Ymut mmR3 contain the CTCF target sequence of the chicken HS4 insulator [57] and the CTCF target region of the mouse imprinting control region R3 [10]. (B) Top: control experiments revealed the sensitivity of CTCF binding to DNA methylation (CpG me) at the myc-A and IGF2 huB1 templates. Bottom: methylation of the 105-bp Ywt template did not affect the recruitment of CTCF. While methylated chicken FII CTCF target sites efficiently recruited CTCF, CpG methylation of the mouse R3 sequence decreased the binding of CTCF.
Figure 5
Figure 5
DNA methylation analysis of the IGF2BP1 CTCF binding region. Analysis of DNA methylation with bisulfite sequencing at the intronic CTCF binding region of the IGF2BP1 gene is shown. (A) The percentage of methylation of CpG sites in gDNA derived from cell lines that express IGF2BP1 from only one allele (GM7016, GM6989) or from both alleles (GM7057) is shown. The CpG residue located within the CTCF binding motif is invariably methylated and is indicated by the thick black bar located adjacent to CpG site 7 (indicated by asterisks). (B) The percentage of methylation at each CpG site of the IGF2BP1 CTCF site in DNA samples recovered from anti-H3K9me3 ChIP. (C) The percentage of methylation at each CpG site of the IGF2BP1 CTCF site in DNA samples recovered from anti-CTCF ChIP experiments. The level of DNA methylation is represented according to the heat map keys located at the bottom of the figure.
Figure 6
Figure 6
Allelic specificity of CTCF and H3K9me3. Informative ChIP templates were analyzed using the TaqMan allelic discrimination assay to address the allelic association of CTCF and H3K9me3. (A) Genotyping results at rs11870560 identify informative cell lines useful for the detection of allele-specific association of CTCF and H3K9me3. gDNA obtained from monoallelic and biallelic cell lines were genotyped using the TaqMan allelic discrimination assay. Squares represent gDNA samples and are coded in red and green to represent cell lines that are homozygous for allele C and allele T, respectively. Orange indicates heterozygous individuals. Averaged triplicate of a no-template control (NTC) is shown near the origin of the graph. (B) Genotyping at SNP rs11870560 with DNA templates recovered from ChIP experiments was used to identify the enrichment of the two alleles with either CTCF (circle) or H3K9me3 (triangle). Each color shown in the figure key represents a lymphoblastoid cell line (LCL) derived from an individual of the pedigree, while the shape represents the source of each sample (for example, squares signify input samples, while circles and triangles indicate ChIP samples obtained with CTCF and H3K9me3 antibodies, respectively). Immunoprecipitated templates were generated using the ChIP protocol described in Materials and Methods. Both monoallelic and biallelic cell lines indicate biallelic distribution of both CTCF and H3K9me3. Diamonds indicate control LCL samples (standards) previously genotyped as homozygous CC, heterozygous CT and homozygous TT.
Figure 7
Figure 7
IGF2BP1 promoter region is enriched with activating and silencing chromatin modifications. DNA recovered from ChIP experiments using anti-H3K4me3, anti-H3K27me3 and RNA polymerase II ChIP templates was genotyped by sequencing the IGF2BP1 promoter region containing sequence variant rs4794017 or rs9890278. Left: Enrichment of H3K4me3 (K4) and H3K27me3 (K27) in monoallelically (GM7007, GM6989), and biallelically (GM7057) expressing cell lines. The positions of informative SNPs rs479017 and rs9890278 are shown in Figure 1. Both activating and silencing marks are significantly enriched. Right: Sequences enriched by ChIP were excised and sequenced. The results show an association of both alleles with active and silent histone modifications at the IGF2BP1 promoter region independent of transcriptional status.
Figure 8
Figure 8
RNA polymerase II associates with both alleles in a monoallelically expressing cell line. (A) Recruitment of RNA polymerase II to the IGF2BP1 promoter was examined by ChIP in monoallelically expressing GM7007 cells. DNA recovered from chromatin that had been immunoprecipitated with anti-RNA polymerase II antibodies (Pol2) was amplified and sequenced for allelic association. Sequencing results (bottom) reveal that both alleles of the monoallelically expressing cell line GM7007 associate with RNA polymerase II near SNP site rs4794017. In contrast, sequencing of DNA from "no antibody" ChIP reactions failed to produce sequence reads. (B) Allele specificity of precursor mRNA was determined by sequencing of cDNA prepared from total RNA of GM7007 cells. RNA had been extensively pretreated with DNase I to eliminate gDNA prior to reverse transcription by RT. Subsequently, cDNA samples were amplified using primers flanking rs4794017. In the absence of RT (-RT), no amplification products were oberved. +RT amplicons were gel-purified and sequenced. Bottom: Sequence traces at the heterozygous SNP site rs4794017 located 1 kb downstream of the transcription initiation site in cDNA of GM7007 indicate a single allele.

Similar articles

Cited by

References

    1. Delaval K, Feil R. Epigenetic regulation of mammalian genomic imprinting. Curr Opin Genet Dev. 2004;14:188–195. doi: 10.1016/j.gde.2004.01.005. - DOI - PubMed
    1. Ferguson-Smith AC, Surani MA. Imprinting and the epigenetic asymmetry between parental genomes. Science. 2001;293:1086–1089. doi: 10.1126/science.1064020. - DOI - PubMed
    1. Gregg C, Zhang J, Weissbourd B, Luo S, Schroth GP, Haig D, Dulac C. High-resolution analysis of parent-of-origin allelic expression in the mouse brain. Science. 2010;329:643–648. doi: 10.1126/science.1190830. - DOI - PMC - PubMed
    1. Chess A, Simon I, Cedar H, Axel R. Allelic inactivation regulates olfactory receptor gene expression. Cell. 1994;78:823–834. doi: 10.1016/S0092-8674(94)90562-2. - DOI - PubMed
    1. Bix M, Locksley RM. Independent and epigenetic regulation of the interleukin-4 alleles in CD4+ T cells. Science. 1998;281:1352–1354. - PubMed

LinkOut - more resources