. 2011 Aug 3:11:331.
doi: 10.1186/1471-2407-11-331.

Long-term exposure to hypoxia inhibits tumor progression of lung cancer in rats and mice

Affiliations

Long-term exposure to hypoxia inhibits tumor progression of lung cancer in rats and mice

Lunyin Yu et al. BMC Cancer. .

Abstract

Background: Hypoxia has been identified as a major negative factor for tumor progression in clinical observations and in animal studies. However, the precise role of hypoxia in tumor progression has not been fully explained. In this study, we extensively investigated the effect of long-term exposure to hypoxia on tumor progression in vivo.

Methods: Rats bearing transplanted tumors consisting of A549 human lung cancer cells (lung cancer tumor) were exposed to hypoxia for different durations and different levels of oxygen. The tumor growth and metastasis were evaluated. We also treated A549 lung cancer cells (A549 cells) with chronic hypoxia and then implanted the hypoxia-pretreated cancer cells into mice. The effect of exposure to hypoxia on metastasis of Lewis lung carcinoma in mice was also investigated.

Results: We found that long-term exposure to hypoxia a) significantly inhibited lung cancer tumor growth in xenograft and orthotopic models in rats, b) significantly reduced lymphatic metastasis of the lung cancer in rats and decreased lung metastasis of Lewis lung carcinoma in mice, c) reduced lung cancer cell proliferation and cell cycle progression in vitro, d) decreased growth of the tumors from hypoxia-pretreated A549 cells, e) decreased Na+-K+ ATPase α1 expression in hypoxic lung cancer tumors, and f) increased expression of hypoxia inducible factors (HIF1α and HIF2α) but decreased microvessel density in the lung cancer tumors. In contrast to lung cancer, the growth of tumor from HCT116 human colon cancer cells (colon cancer tumor) was a) significantly enhanced in the same hypoxia conditions, accompanied by b) no significant change in expression of Na+-K+ ATPase α1, c) increased HIF1α expression (no HIF2α was detected) and d) increased microvessel density in the tumor tissues.

Conclusions: This study demonstrated that long-term exposure to hypoxia repressed tumor progression of the lung cancer from A549 cells and that decreased expression of Na+-K+ ATPase was involved in hypoxic inhibition of tumor progression. The results from this study provide new insights into the role of hypoxia in tumor progression and therapeutic strategies for cancer treatment.


Figures

Figure 1
Figure 1
Experimental Protocols. (A) Animals in normoxia for 14 days after tumor cell injection. (B) Animals in hypoxia for 14 days after tumor cell injection. (C) Animals in normoxia for 4 days after tumor cell injection and then in hypoxia for 10 days. (D) Animals in normoxia for 7 days after tumor cell injection and then in hypoxia for 7 days. (E) Followed in normoxia for 4 days after tumor cell injection, animals were placed in hypoxia for 10 days and then returned to normixa for another 7 days.
Figure 2
Figure 2
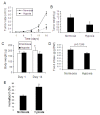
Effect of hypoxia to hypoxia for 14 days on tumor growth of lung cancer in rats. After cancer cell injection, animals were exposed to hypoxia (10% O2) for 14 days (Figure 1B). (A) Tumor growth curve, (B) Tumor weight, (C) Body weight, (D) Food intake and (E) Hematocrit. * p < 0.05 as compared with normoxia. n = 6 for each group.
Figure 3
Figure 3
Effect of hypoxia to hypoxia for 10 days or 7 days on tumor growth of lung cancer in rats.(A to E) Exposure to hypoxia for 10 days in xenograft model (Figure 1C) : (A) Tumor growth curve, (B) Tumor weight, (C) ratio of tumor weight to body weight, (D) Distribution of tumor size (upper panel) and representative tumor samples (lower panel), (E) Hematocrit. *p < 0.05 as compared with normoxia. n = 21 for normoxia group and 22 for hypoxia group. (F & G) Exposure to hypoxia for 7 days in xenograft model (Figure 1D): (F) Tumor growth curve and (G) tumor weight. n = 5 for each group. *p < 0.05 as compared with normoxia. (H & I) Exposure to hypoxia for 10 days in orthotopic model (Figure 1C): (H) Tumor weight and (I) lymph node number from orthotopic rats exposed to hypoxia for 10 days. *p < 0.05 as compared with normoxia. n = 5 for each group.
Figure 4
Figure 4
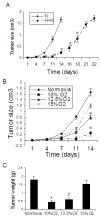
Normoxia recovery and different levels of oxygen on lung cancer tumor growth in rats. Effect of normoxia recovery on hypoxia-induced reduction of lung cancer tumor growth (Figure 1E): (A) Tumor growth curve. Because large tumor mass was not allowed in living animals, we sacrificed the control rats when the tumor size reached over 1.5 cm. N = Rats under normoxia for entire experiment. H+N = Rats under hypoxia for 10 days and then under normoxia for another 8 days. Effect of different levels of oxygen on lung cancer tumor growth (Figure 1C) (B & C): (B) Tumor growth curve and (C) Tumor weight. n = 5 for each group. *p < 0.05 as compared with normoxia.
Figure 5
Figure 5
Effect of hypoxia on lung metastasis of Lewis lung carcinoma in mice. On the fourth day after cancer cell injection, the animals were placed under 10% hypoxia for 17 days (total of 3 weeks). After hypoxia exposure, the mice were sacrificed and lung metastasis nodules were counted. (A) Number of metastatic nodules in mouse lungs, (B) Representative lungs showing metastatic nodules the lungs. More and bigger metastasis nodules were seen in hypoxic mouse lungs than in normoxic lungs (arrows). (C) Quantitative data on primary tumor weight. *p < 0.05 as compared with normoxia. n = 10 mice for each group.
Figure 6
Figure 6
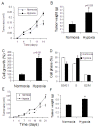
Effect of hypoxia on lung cancer cell proliferation and cell progression in vitro and hypoxia-pretreatment on tumor growth in mice. A549 cells were cultured in 0.5% hypoxia for 7 days and then harvested for cell proliferation assay and cell cycle progression analysis. In addition, the harvested cancer cells were inoculated into nude mice subcutaneously. After 21 days, the animals were sacrificed and the tumors were collected. (A) Cell growth assay and (B) cell cycle progression analysis in vitro (n = 9 for each group); (C) Tumor growth and (D) Tumor weight in mice. n = 7 for each group.
Figure 7
Figure 7
Hypoxia exposure and colon cancer tumor growth.(A & B) Effect of hypoxia on colon cancer tumor growth (Figure 1C): Four days under normoxia after HCT116 colon cancer cell injection, animals were exposed to hypoxia (10% O2) for 10 days from xenograft model (protocols Figure 1C). (A) Tumor growth curve and (B) Tumor weight. *p < 0.05 as compared with normoxia. n = 6 rats for each group. (C to F) Effect of hypoxia-pretreatment on colon cancer tumor growth: HCT116 cells were cultured in 0.5% hypoxia for 7 days and then harvested for cell proliferation assay and cell progression analysis. In the meantime, the harvested cancer cells were inoculated into nude mice subcutaneously. After 21 days, the animals were sacrificed and the tumors were collected. (C) Cell growth assay and (D) cell cycle progression analysis in vitro (n = 9 for each group); (E) Tumor growth and (F) Tumor weight in mice. n = 5 for each group. *p < 0.05 as compared with normoxia.
Figure 8
Figure 8
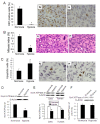
Cell proliferation, apoptosis and Na+-K+ ATPase expression in lung cancer tumors. Immunohistochemistry was used to evaluate cell proliferation and apoptosis. Mitosis was analyzed in slides with H & E stain. (A) Percent Ki67 positive cell number for cell proliferation; (B) Mitosis index and (C) Apoptosis. Left panel showing quantitative data and right panel showing representative micrographs. n = 5 for each group. Expression of Na+-K+ ATPase α1 in lung cancer tumors and colon cancer tumors (D to F): Proteins were isolated from the tumors and Western blot was performed for analysis of Na+-K+ ATPase α1 expression. Expression of Na+-K+ ATPase α1 in lung cancer tumor in rats (D) and in A549 cells and in the lung cancer tumor from hypoxia-pretreated A549 cells in mice (E). (F) Na+-K+ ATPase α1 expression in colon cancer tumor in rats (F). n = 3 for each group. Upper panels show representative images and lower panels show quantitative data, setting normoxia as 1. *p < 0.05 as compared with normoxia.
Figure 9
Figure 9
HIF expression and microvessel density in lung and colon cancer tumors.(A to C) Expression of HIF1α and 2α: Proteins were isolated from lung cancer tumors and colon cancer tumors and Western blot was performed for analysis of HIF expression. (A) Expression HIF1α mRNA and protein in lung cancer tumor; (B) Expression HIF1α in colon cancer tumor and (C) Expression of HIF2α protein in lung and colon cancer tumors. Left panels show quantitative data, setting normoxia as 1, and right panels show representative images of Western blot. n = 3 for each group. *p < 0.05 as compared with normoxia group. (D & E) Microvessel density: Immunohistochemical staining with CD31 antibody was performed to identify microvessels. Microvessel density in lung cancer tumors (D) and in colon cancer tumors (E). Left panels show quantitative data and right panels show representative images of immunohistochemistry (tumor from rats). Tumor = implanted tumor grown in rats. H-P-tumor = tumor from hypoxia-pretreated cancer cells grown in mice. Per HFP = average number of microvessels with CD31 positive staining/per high power field (× 200). n = 3 animals for each group. *p < 0.05 as compared with normoxia group.

Similar articles

Cited by

References

    1. Jemal A, Siegel R, Ward E, Hao Y, Xu J, Murray T, Thun MJ. Cancer statistics, 2008. CA Cancer J Clin. 2008;58(2):71–96. doi: 10.3322/CA.2007.0010. - DOI - PubMed
    1. Parkin DM, Bray F, Ferlay J, Pisani P. Global cancer statistics, 2002. CA Cancer J Clin. 2005;55(2):74–108. doi: 10.3322/canjclin.55.2.74. - DOI - PubMed
    1. Yang BH, Parkin DM, Cai L, Zhang ZF. Cancer burden and trends in the Asian Pacific Rim region. Asian Pac J Cancer Prev. 2004;5(2):96–117. - PMC - PubMed
    1. Bray F, Møller B. Predicting the future burden of cancer. Nat Rev Cancer. 2006;6(1):63–74. doi: 10.1038/nrc1781. - DOI - PubMed
    1. Jemal A, Siegel R, Xu J, Ward E. Cancer statistics, 2010. CA Cancer J Clin. 2010;60(5):277–300. doi: 10.3322/caac.20073. - DOI - PubMed

Publication types

MeSH terms

Substances