. 2012 May;61(5):695-705.
doi: 10.1136/gutjnl-2011-300012. Epub 2011 Aug 3.

Neuronal guidance molecule netrin-1 attenuates inflammatory cell trafficking during acute experimental colitis

Affiliations

Neuronal guidance molecule netrin-1 attenuates inflammatory cell trafficking during acute experimental colitis

Carol M Aherne et al. Gut. 2012 May.

Abstract

Background: Inflammatory bowel diseases, encompassing Crohn's disease and ulcerative colitis, are characterised by persistent leucocyte tissue infiltration leading to perpetuation of an inappropriate inflammatory cascade. The neuronal guidance molecule netrin-1 has recently been implicated in the orchestration of leucocyte trafficking during acute inflammation. We therefore hypothesised that netrin-1 could modulate leucocyte infiltration and disease activity in a model of inflammatory bowel disease.

Design: DSS-colitis was performed in mice with partial genetic netrin-1 deficiency (Ntn-1(+/-) mice) or wild-type mice treated with exogenous netrin-1 via osmotic pump to examine the role of endogenous and therapeutically administered netrin-1. These studies were supported by in vitro models of transepithelial migration and intestinal epithelial barrier function.

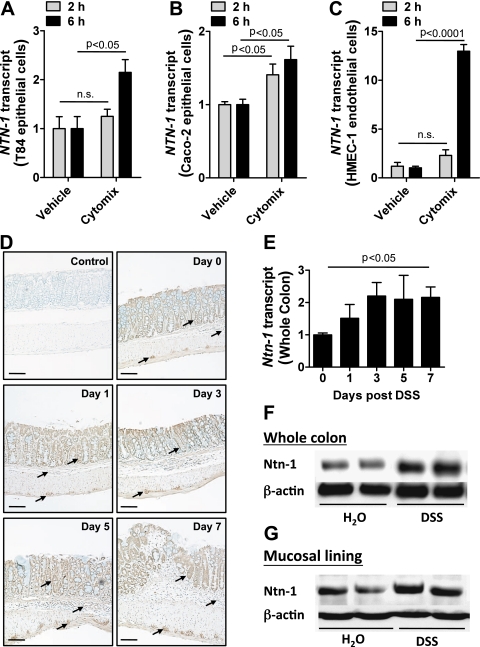
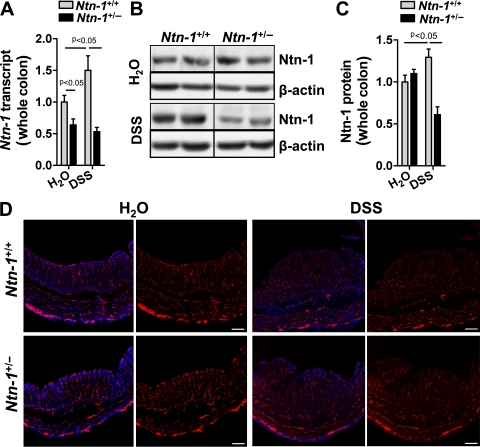
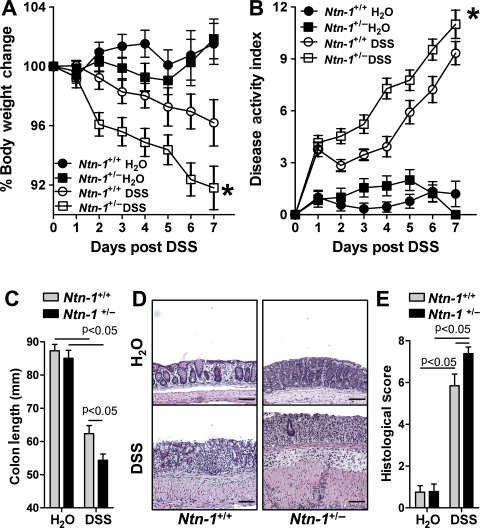
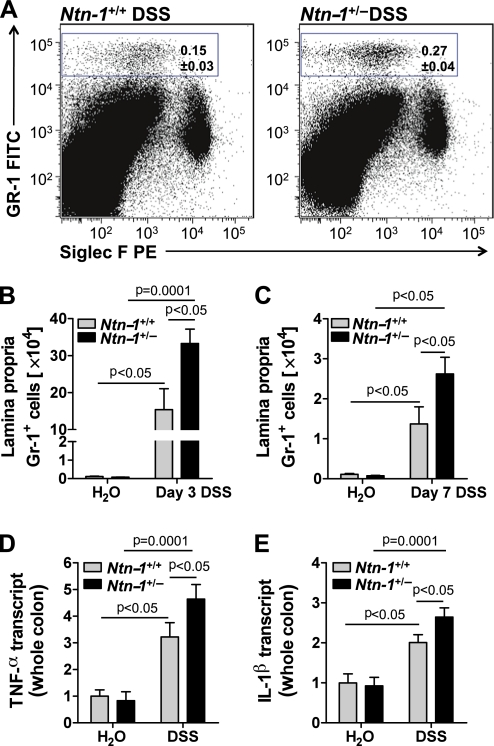
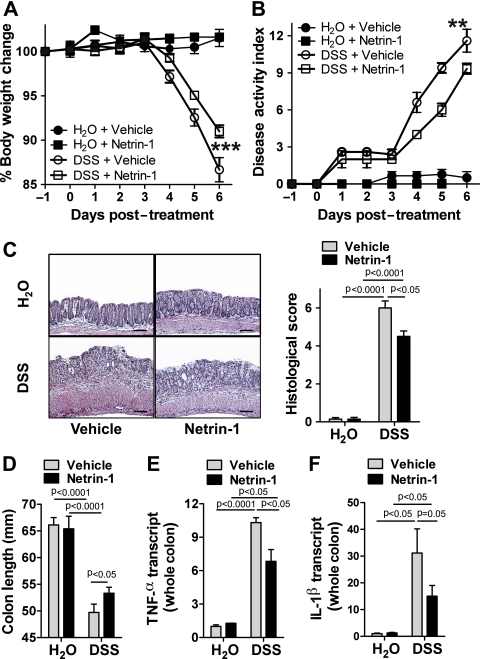
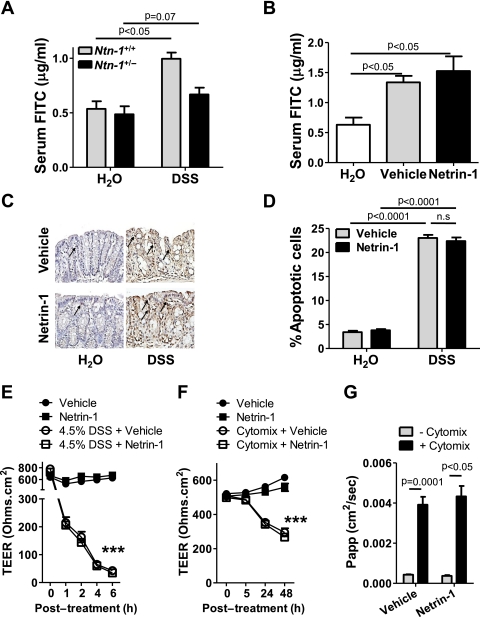
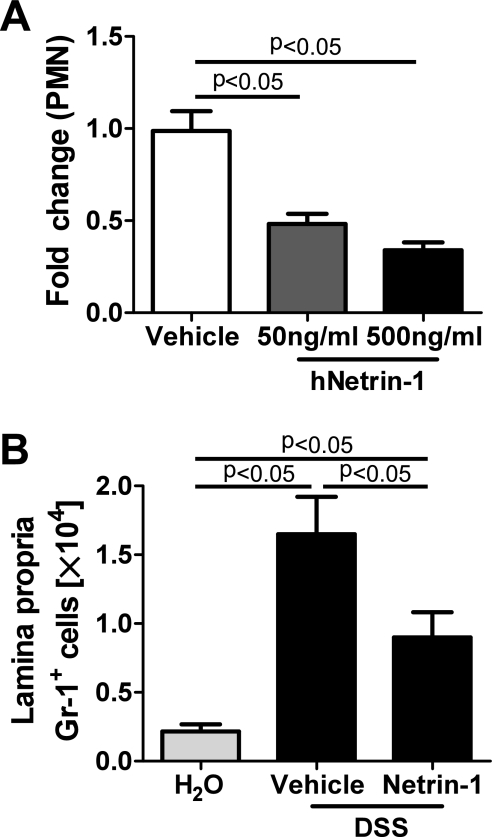
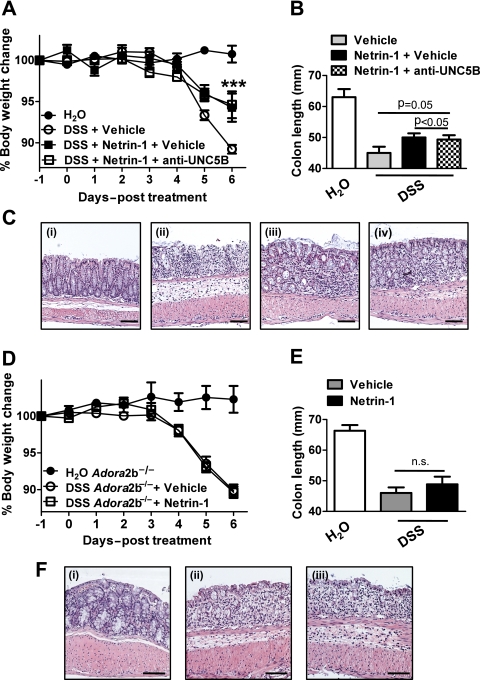
Results: Consistent with our hypothesis, we observed induction of netrin-1 during intestinal inflammation in vitro or in mice exposed to experimental colitis. Moreover, mice with partial netrin-1 deficiency demonstrated an exacerbated course of DSS-colitis compared to littermate controls, with enhanced weight loss and colonic shortening. Conversely, mice treated with exogenous mouse netrin-1 experienced attenuated disease severity. Importantly, permeability studies and quantitative assessment of apoptosis reveal that netrin-1 signalling events do not alter mucosal permeability or intestinal epithelial cell apoptosis. In vivo studies of leucocyte transmigration demonstrate suppression of neutrophil trafficking as a key function mediated by endogenous or exogenously administered netrin-1. Finally, genetic studies implicate the A2B adenosine receptor in netrin-1-mediated protection during DSS-colitis.

Conclusions: The present study identifies a previously unrecognised role for netrin-1 in attenuating experimental colitis through limitation of neutrophil trafficking.


Conflict of interest statement

Competing interests: None.

Figures

Figure 1
Figure 1
Netrin-1 expression in response to inflammation. T84 intestinal epithelial cells (A), Caco-2 intestinal epithelial cells (B) or HMEC-1 microvascular endothelial cells (C) were exposed to a combination of tumor necrosis factor (TNF) α, interleukin (IL) 1β and interferon (IFN) γ (cytomix; all at 10 ng/ml) or vehicle (0.1% bovine serum albumin (BSA)/phosphate-buffered saline (PBS)) for 2 h or 6 h followed by total RNA isolation and analysis of netrin-1 transcript levels (NTN-1). NTN-1 expression was calculated relative to β-actin and expressed as fold change relative to vehicle treatment±SEM for each timepoint. Results are derived from independent experiments at each individual time point, performed in triplicate. (D) Gender-, age- and weight-matched C57BL/6 mice exposed to water or DSS (4.5%) over a timecourse of 7 days were sacrificed at 2-day intervals post DSS administration (days 0, 1, 3, 5 and 7), and whole colon was harvested by blunt dissection. Paraffin-embedded sections of whole colon were deparaffinised and rehydrated for immunohistochemical staining with a chicken anti-netrin-1 specific antibody (1:100) followed by DAB development (brown staining) and counterstaining with methyl green (green staining). Primary antibody was omitted as negative control (control). Representative images were acquired at 10X using a Nikon Eclipse Ti-S microscope, DS-Fi1 1.0X camera. Bar represents 100 μm. (E) Total RNA was isolated from whole colonic tissue isolated at different time intervals of DSS administration as described (D), and netrin-1 transcript levels (Ntn-1) were determined by real-time reverse transcriptase polymerase chain reaction (RT-PCR). Ntn-1 expression was calculated relative to β-actin and expressed as fold change relative to water-exposed mice±SEM. (F) Whole colon was harvested following DSS exposure as described (D). Total protein was isolated, and netrin-1 (Ntn-1) expression at 7 days post DSS was determined by sodium dodecyl sulfate polyacrylamide gel electrophoresis (SDS-PAGE) with β-actin as loading control. (G) Colonic mucosal scrapings were harvested post DSS (described in D). Netrin-1 (Ntn-1) expression in the mucosal layer at 7 days post DSS was determined by SDS-PAGE with β-actin as loading control. In vivo DSS time course data represent five mice per time point, and western blot data are representative of greater than three independent experiments with six to eight mice per group.
Figure 2
Figure 2
Netrin-1 expression and enteric neuronal patterning in mice with partial netrin-1 deficiency following DSS-colitis. Age-, weight-, and sex-matched mice with partial netrin-1 deficiency (Ntn-1+/−) and their wild-type controls (Ntn-1+/+) were exposed to water or DSS (4.5%) for 7 days, followed by sacrifice and harvesting of the whole colon by blunt dissection. (A) Total RNA was extracted, and Ntn-1 transcript levels determined by real-time reverse transcriptase polymerase chain reaction (RT-PCR). Ntn-1 expression was calculated relative to β-actin and expressed as fold change relative to water-exposed Ntn-1+/+ mice±SEM. (B) Total protein was extracted, and Ntn-1 levels were determined by sodium dodecyl sulfate polyacrylamide gel electrophoresis (SDS-PAGE) with β-actin as the loading control. (C) Densitometric analysis of netrin-1 expression in mucosal scrapings as mean fold change relative to water-exposed Ntn-1+/+ mice±SEM. Results are representative of at least three independent experiments with six to eight mice per group. (D) Representative images of immunofluorescence staining performed on frozen sections from whole colon of mice with partial netrin-1 deficiency (Ntn-1+/−) or wild-type controls (Ntn-1+/+) exposed to water or DSS using an anti-PGP9.5 antibody (red) and counterstaining with DAPI (blue). Images were acquired with a QImaging Retiga-400RV at 10X. Bar represents 100 μm. Results represent analysis of mice at 3 and 7 days post DSS stained as a whole mount and in sequential sections (n=2 mice per group).
Figure 3
Figure 3
Disease activity in mice with partial netrin-1 deficiency during DSS-colitis. Gender-, age- and weight-matched mice with partial netrin-1 deficiency (Ntn-1+/−) and their wild-type controls (Ntn-1+/+) were exposed to DSS (4.5%) for 7 days, followed by sacrifice and harvesting of the whole colon by blunt dissection. (A) Daily weight measurements were obtained for each group of mice. p<0.05 as measured by analysis of variance (ANOVA). (B) Daily disease activity measurements encompassing weight, stool consistency and presence of blood were assessed for each group of mice. p<0.05 as measured by ANOVA. (C) At harvest, colon length was measured for each mouse and is displayed as the mean±SEM. (D) Representative histological sections from whole colon of Ntn-1+/+ or Ntn-1+/− mice harvested following 7 days of DSS or water. Bar represents 100 μm. Images acquired at 10X using Olympus BX51. (E) Blinded histological scoring of colonic tissue post DSS. All results are representative of three independent experiments with six to eight mice per group and are displayed as mean±SEM.
Figure 4
Figure 4
Colonic inflammatory infiltrate following DSS-colitis in Ntn-1+/+ and Ntn-1+/− mice. Gender-, age- and weight-matched mice with partial netrin-1 deficiency (Ntn-1+/−) and their wild-type controls (Ntn-1+/+) were exposed to DSS (4.5%) for 3 or 7 days, followed by sacrifice and harvesting of the whole colon by blunt dissection. Colonic lamina propria leucocytes were isolated, and flow cytometric analysis of GR-1+ (neutrophils) and SiglecF+ (eosinophils) granulocytes was performed. (A) Representative dot plots showing GR-1+ granulocytes from the colonic lamina propria of Ntn-1+/+ and Ntn-1+/− mice post DSS. (B) The number of GR-1+ granulocytes in the colonic lamina propria following 3 days of water or DSS in Ntn-1+/+ and Ntn-1+/− mice. (C) The number of GR-1+ granulocytes in the colonic lamina propria following 7 days of water or DSS in Ntn-1+/+ and Ntn-1+/− mice. (D, E) Following whole colon harvest, total RNA was extracted, and tumor necrosis factor (TNF) α (D) or interleukin (IL) 1β (E) transcript levels were determined by real-time reverse transcriptase polymerase chain reaction (RT-PCR). Gene expression was calculated relative to β-actin and expressed as fold change relative to water-exposed Ntn-1+/+ mice±SEM. Results represent two independent experiments with four mice per group (flow cytometry) or six to eight mice per group (RT-PCR).
Figure 5
Figure 5
Exogenous netrin-1 treatment in DSS-colitis. Gender-, age- and weight-matched C57BL/6 mice were treated with netrin-1 (1 μg/mouse/day) or vehicle (1% bovine serum albumin (BSA)/phosphate-buffered saline (PBS)) using a subcutaneous osmotic pump beginning 1 day prior to administration of (day −1) water or DSS (4.5%) for 6 days, followed by sacrifice and harvesting of the whole colon by blunt dissection. (A) Daily weight measurements were obtained for each group of mice. p<0.05 by analysis of variance (ANOVA). (B) Assessment of daily disease activity measurements, encompassing weight, stool consistency and presence of blood, was performed for each group of mice. p<0.05 by ANOVA. (C) Representative histological images from vehicle- and netrin-1-treated mice exposed to water or 4.5% DSS. Bar represents 100 μm. Images acquired at 10X using Olympus BX51. Bar graph of blinded histological scoring of colonic tissue post treatment displayed as the mean±SEM. (D) Colon length measurements for each mouse were taken following harvest at day 6 post DSS and are displayed as mean±SEM. (E, F) Following whole colon harvest, total RNA was extracted, and tumor necrosis factor (TNF) α (E) or interleukin (IL) 1β (F) transcript levels were determined by real-time reverse transcriptase polymerase chain reaction (RT-PCR). Gene expression was calculated relative to β-actin and expressed as fold change relative to water-exposed vehicle-treated mice±SEM. Results represent 3 independent experiments with six to eight mice per group.
Figure 6
Figure 6
Netrin-1 effects on the intestinal epithelial barrier. (A) Mice with partial netrin-1 deficiency (Ntn-1+/−) and their wild-type controls (Ntn-1+/+) were exposed to DSS for 3 days (described in figure 3) prior to oral gavage with FITC-dextran (4 kDa; 0.6 mg/g at 80 mg/ml). Fluorescence measurement (478 nm) was used to determine FITC in the serum 4 h later and is displayed as mean FITC (μg/ml)±SEM. (B) Mice with vehicle or netrin-1 treatment (described in figure 5) were exposed to DSS for 3 days prior to oral gavage with FITC-dextran (4 kDa 0.6 mg/g at 80 mg/ml), and serum FITC levels were determined and displayed as described in A. (C) Representative images of apoptotic colonic epithelial cells identified by TUNEL staining of paraffin-embedded colonic sections following treatment of mice with netrin-1 or vehicle and exposure to DSS for 6 days (described in figure 5). Images were acquired at 20X using a Nikon Eclipse Ti-S microscope, DS-Fi1 1.0X camera and represent at least six mice per group. (D) Quantification of the percentage of apoptotic colonic epithelial cells in vehicle- or netrin-1-treated mice following 6 days of DSS exposure (described in figure 5). Scoring was carried out in a blinded fashion with counting of 600 cells over three randomly selected fields per section with six mice per group. (E) Caco-2 intestinal epithelial monolayers cultured as monolayers on transwell permeable supports for at least 3 weeks prior were exposed to 4.5% DSS in the apical and basolateral chamber, with vehicle or human recombinant netrin-1 (500 ng/ml) co-treatment. Transepithelial electrical resistance (TEER) measurements were taken at time intervals indicated (24 h not shown) and are displayed as mean resistance measurements (Ohms.cm2)±SEM. (F) Caco-2 cells were cultured as described (E) prior to basolateral treatment with tumor necrosis factor (TNF) α, interleukin (IL) 1β and interferon (IFN) γ (cytomix; all 10 ng/ml) plus vehicle or human recombinant netrin-1 (500 ng/ml) for 48 h. TEER measurements were taken at time intervals indicated. (G) FITC-dextran (3 kDa; 250 μg/ml) was applied to the apical compartment of Caco-2 monolayers treated for 48 h as described in F. Appearance of FITC in the basolateral compartment was measured over a 3 h period and analysed as described in A. Results displayed as the apparent permeability of the monolayer (Papp; cm2/s). In vivo FITC measurements represent five mice per group. In vitro experiments represent four individual wells per treatment from two separate experiments.
Figure 7
Figure 7
Netrin-1 effects on inflammatory infiltrate in vitro and in vivo. (A) Neutrophils (PMN) were harvested from whole human blood and applied at 1X10⁶ PMN in the presence of vehicle or increasing concentrations of human recombinant netrin-1 (50–500 ng/ml) to the basolateral aspect of Caco-2 intestinal epithelial cells grown to confluence on inverted permeable supports. fMLP (1 μM) was added to the apical aspect of each well. Presence of transmigrated neutrophils in the apical compartment was measured by myeloperoxidase levels and is displayed as the mean fold change in PMN numbers relative to vehicle±SEM. Results represent at least triplicate wells from three independent experiments. (B) C57BL/6 mice were treated with netrin-1 (1 μg/mouse/day) or vehicle prior to exposure to water or DSS as described in figure 5. Following colon harvest at day 6 post DSS, colonic lamina propria leucocytes were isolated, and flow cytometric analysis of GR-1+ (neutrophils) and SiglecF+ (eosinophils) granulocytes was performed. The number of GR-1+ granulocytes is displayed as mean±SEM for four mice.
Figure 8
Figure 8
Specific blockade of netrin-1 receptors during exogenous netrin-1 treatment in DSS-colitis. (A) Gender-, age- and weight-matched C57BL/6 mice were treated with anti-UNC5B antibody (800 μg/kg) or control goat immunoglobulin (Ig) G (800 μg/kg) intraperitoneally 2 days prior to administration of water or DSS (3.5%) followed by repeated administration of blocking antibody or control IgG at days 0, 2, and 4 of DSS exposure. Netrin-1 (1 μg/mouse/day) or vehicle (1% bovine serum albumin (BSA)/phosphate-buffered saline (PBS)) delivery using a subcutaneous osmotic pump commenced 1 day prior to administration (day −1) of water or DSS for 6 days, followed by sacrifice and harvesting of the whole colon by blunt dissection. (A) Daily weight measurements were obtained for each group of mice. p<0.05 by analysis of variance (ANOVA). (B) Colon length measurements for each mouse were taken following harvest at day 6 post DSS and are displayed as mean±SEM. (C) Representative histological images from (i) water controls, (ii) DSS-exposed mice treated with control IgG and BSA/PBS vehicle, (iii) DSS-exposed mice treated with netrin-1 and control IgG and (iv) DSS-exposed mice treated with netrin-1 and anti-UNC5b antibody. Bar represents 100 μm. Images acquired at 10X using an Olympus BX51. (D–F) Gender-, age- and weight-matched A2B receptor-deficient mice (Adora2b−/−) were treated with netrin-1 (1 μg/mouse/day) or vehicle (1% BSA/PBS) using a subcutaneous osmotic pump commencing 1 day prior to administration (day −1) of water or DSS (3.5%) for 6 days, followed by sacrifice and harvesting of the whole colon by blunt dissection. (D) Daily weight measurements were obtained for each group of mice. (E) Colon length measurements for each mouse were taken following harvest at day 6 post DSS and are displayed as mean±SEM. (F) Representative histological images from (i) water controls, (ii) DSS-exposed mice treated with BSA/PBS vehicle and (iii) DSS-exposed mice treated with netrin-1. Bar represents 100 μm. Images acquired at 10X using an Olympus BX51. Experiments are representative of six to eight mice per group.

References

    1. Serafini T, Kennedy TE, Galko MJ, et al. The netrins define a family of axon outgrowth-promoting proteins homologous to C. elegans UNC-6. Cell 1994;78:409–24 - PubMed
    1. Rosenberger P, Schwab JM, Mirakaj V, et al. Hypoxia-inducible factor-dependent induction of netrin-1 dampens inflammation caused by hypoxia. Nat Immunol 2009;10:195–202 - PubMed
    1. Yebra M, Montgomery AM, Diaferia GR, et al. Recognition of the neural chemoattractant Netrin-1 by integrins alpha6beta4 and alpha3beta1 regulates epithelial cell adhesion and migration. Dev Cell 2003;5:695–707 - PubMed
    1. Strizzi L, Bianco C, Raafat A, et al. Netrin-1 regulates invasion and migration of mouse mammary epithelial cells overexpressing Cripto-1 in vitro and in vivo. J Cell Sci 2005;118:4633–43 - PubMed
    1. Wang W, Reeves WB, Ramesh G. Netrin-1 increases proliferation and migration of renal proximal tubular epithelial cells via the UNC5B receptor. Am J Physiol Renal Physiol 2009;296:F723–9 - PubMed

Publication types

MeSH terms