. 2011 Oct;13(10):1059-73.
doi: 10.1093/neuonc/nor109. Epub 2011 Aug 2.

Gadd45a sensitizes medulloblastoma cells to irradiation and suppresses MMP-9-mediated EMT

Affiliations

Gadd45a sensitizes medulloblastoma cells to irradiation and suppresses MMP-9-mediated EMT

Swapna Asuthkar et al. Neuro Oncol. 2011 Oct.

Abstract

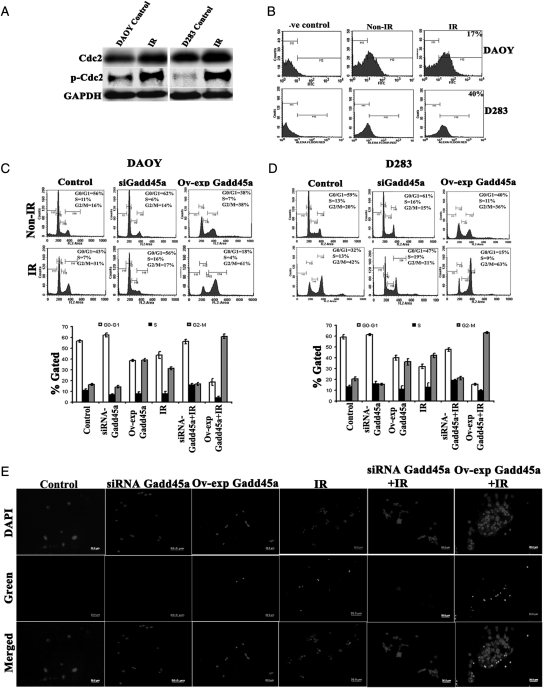
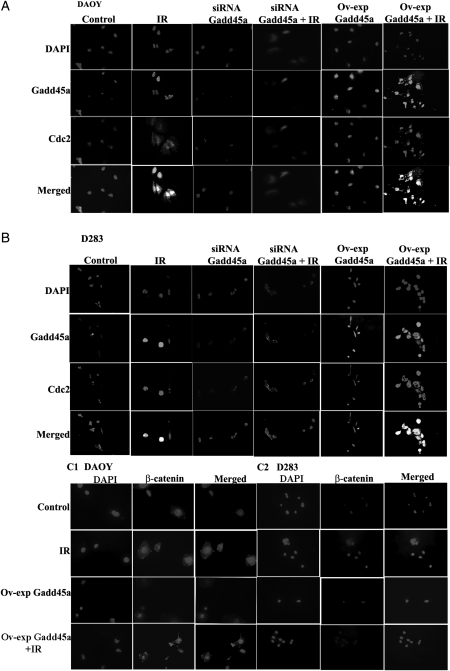
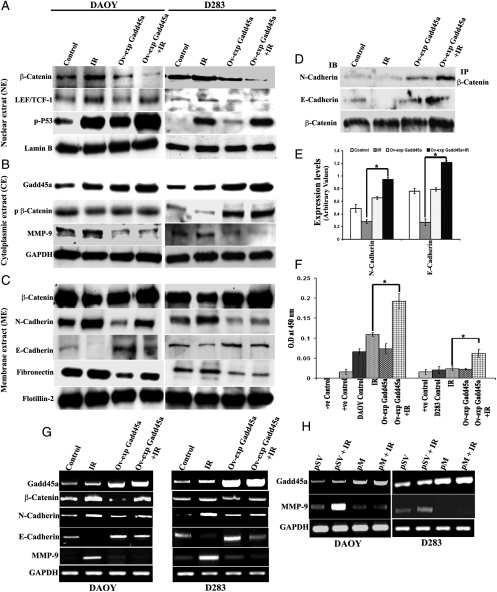
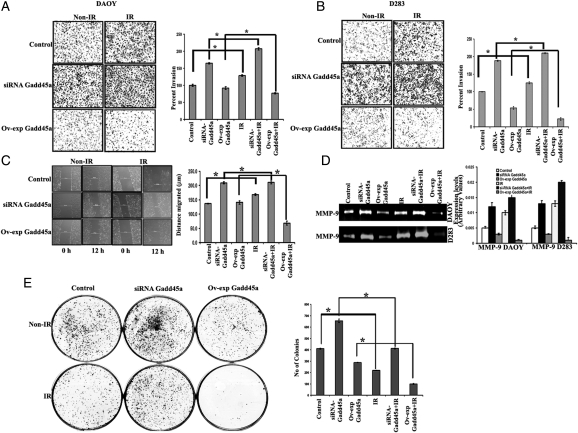
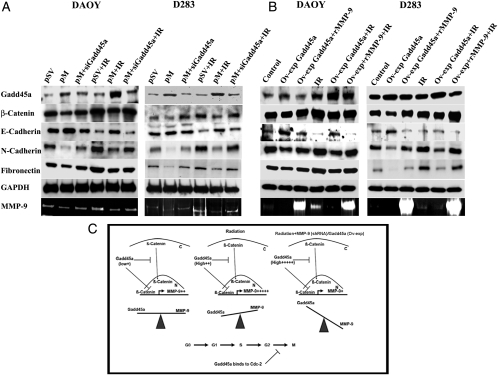
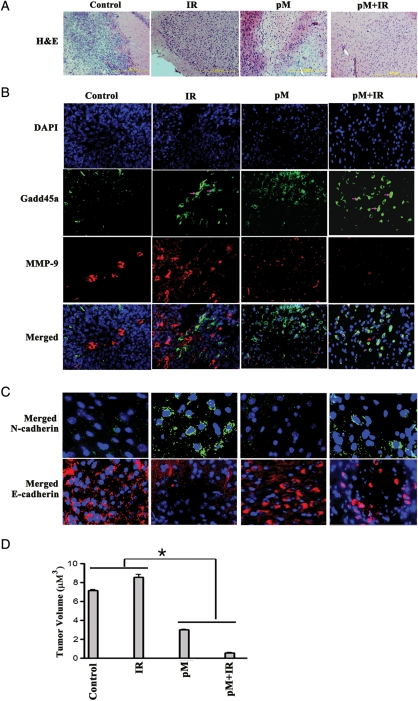
Medulloblastomas are the most common malignant tumors of the central nervous system during childhood. Radiation-induced medulloblastoma tumor recurrences are aggressive and metastatic in nature. In the present study, we demonstrate that Gadd45a expression can sensitize medulloblastoma cells to radiotherapy. We have elucidated the role of Gadd45a in ionizing radiation (IR)-induced G2-M arrest and invasion and metastatic potential of the medulloblastoma cancer cell lines DAOY and D283. We demonstrate that Gadd45a is induced by IR and results in p53 phosphorylation. The role of IR-induced Gadd45a in G2-M arrest is demonstrated by fluorescence-activated cell sorting analysis in the cells treated with siRNA Gadd45a and Ov-exp Gadd45a. We show that Ov-exp Gadd45a aggravates G2-M blockage and also increases binding of Gadd45a to Cdc2 by immunocytochemistry analysis. Furthermore, we show the anti-tumorigenic role of Gadd45a to be mediated by the negative regulation of IR-induced cancer cell invasion and migration-associated proteins, such as matrix metallopeptidase (MMP)-9 and β-catenin. When compared with IR treatment alone, Ov-exp Gadd45a plus IR treatment resulted in decreased nuclear localization and increased membrane localization of β-catenin, and this was further confirmed by membrane distribution. We also show that Ov-exp Gadd45a resulted in downregulation of MMP-9 and suppression of epithelial-mesenchymal transition (EMT). Alternatively, inhibition of MMP-9 (pM) resulted in upregulation of Gadd45a and suppression of EMT. The anti-tumor effect of pM was correlated with increased expression of Gadd45a protein in nude mice intracranial tumors. Taken together, our studies demonstrate that upregulation of Gadd45a or suppression of MMP-9 (pM) with IR retards medulloblastoma tumor metastatic potential.


Figures

Fig. 1.
Fig. 1.
Analysis of cell cycle proteins involved in G2-M arrest after ionizing radiation (IR) treatment. (A) Western blot analysis for Cdc-2 and pCdc-2 protein using 40 µg of total cell lysates from non–IR- and IR-treated DAOY and D283 cells. Equal loading of these proteins was confirmed by glyceraldehyde 3-phosphate dehydrogenase (GAPDH). (B) Immuno-flow cytometry analysis of Alexa Fluor-labeled Gadd45a in DAOY and D283 cells. Approximately 1 × 10⁶ non–IR- and IR-treated cells were trypsinized, washed in phosphate-buffered saline (PBS), incubated with anti-Gadd45a antibody overnight at 4°C, and labeled with green Alexa Fluor 488, a fluorescent-labeled, species-specific secondary antibody (Invitrogen) for 1 h at room temperature. Normal immunoglobulin (Ig) G was used as a negative control to set the cut-off point for green fluorescence intensity. (C and D) Fluorescence-activated cell sorting (FACS) analysis of cell cycle progression using knockdown and overexpression of Gadd45a with IR treatment was done as described in Materials and Methods. The y axis denotes cell count and the x axis represents DNA content. The percentages of cells in the G1 (M2), S (M3) and G2/M (M4) phases of the cell cycle were calculated using CellQuest Pro software. Graphical representation of FACS data from 3 independent experiments is shown as the mean ± SD (P< .05). (E) TUNEL nuclear staining on D283 cells. Control cells with knockdown (siRNA Gadd45a) and overexpression of Gadd45a (Ov-exp Gadd45a) in combination with IR treatment on 8-well chambered slides were subjected to TUNEL nuclear staining (Roche Applied Science) and viewed by fluorescence microscopy. Green fluorescence represents apoptotic cells (For the color figure, please refer to supplementary material, Fig. S1).
Fig. 2.
Fig. 2.
Co-localization of Gadd45a with Cdc2 and nuclear translocation of β-catenin with ionizing radiation (IR) treatment. (A and B) Immunocytochemistry analysis was carried out on DAOY (A) and D283 (B) transfected (siRNA GAdd45a and Ov-exp Gadd45a) and IR-treated cells. Microscopic images depict expression of Gadd45a (green fluorescence) and Cdc2 (red fluorescence) proteins in the cells with knockdown (siRNA Gadd45a) and overexpression of Gadd45a (Ov-exp Gadd45a) in combination with IR treatment. (C1-C2) Nuclear translocation of β-catenin (red fluorescence) into the nucleus (blue fluorescence) of DAOY and D283 cells with Ov-exp-Gadd45a in combination with IR treatment. Immunostaining was done according to the protocol described in Materials and Methods. Pictures were taken using confocal microscopy (Olympus BX61 Fluoview) at a 40× magnification. (For the color figure, please refer to supplementary material, Fig. S4)
Fig. 3.
Fig. 3.
Gadd45a regulates distribution of cellular β-catenin. (A) Western blot analysis of nuclear extracts (NEs) to demonstrate β-catenin, LEF-1, and p-p53 expression in DAOY and D283 cells. Nuclear extracts were prepared using nuclear extraction kit (Panomics). Forty µg of total nuclear protein was used for analysis, and Lamin B was used as a nuclear protein marker to confirm equal loads of proteins. (B) Western blot analysis of cytoplasmic extracts (CEs) to demonstrate the levels of Gadd45a, p-β-catenin (Ser33/37/Thr41) and intracellular levels of MMP-9. GAPDH was used to confirm equal loading of proteins. (C) Western blot analysis of membrane extracts (MEs) to demonstrate accumulation of β-catenin on membranes of DAOY and D283 cells. Membrane proteins were isolated using the Triton X-114 phase separation method. Flotillin-2 was used as a membrane marker to confirm equal loading of proteins. (D) Immunoprecipitation (IP) using β-catenin antibody to show its interaction with N- and E-cadherins of treated DAOY cells. Approximately 400 µg of ME protein was immunoprecipitated with 2 µg of β-catenin primary antibody and immunoblotted using anti-N-cadherin, anti-E-cadherin, and anti-β-catenin antibodies. (E) The protein band intensity of IP studies was measured using densitometry and quantified data from 3 different experiments are represented graphically (mean ± SD, P* < .01). (F) Monitoring p53 activation as assessed by p53 DNA binding using TransAM assay (TransAM, p53 Transcription Factor Assay Kit; Active Motif) as described in Materials and Methods. The experiment was performed at least twice in duplicate and results are graphically represented as bar diagrams. Error bars represent mean ± SD (P* < .01). (G) Reverse-transcription polymerase chain reaction (RT-PCR) analysis to determine the β-catenin, N-cadherin, E-cadherin, and matrix metallopeptidase (MMP)–9 transcript levels in DAOY and D283 control, Ov-exp Gadd45a alone and in combination with IR-treated cells. (H) RT-PCR analysis of DAOY and D283 cells transfected with MMP-9 plasmid (pM) and irradiated after 48 h of transfection. PCR analysis was performed using primers specific for Gadd45a, MMP-9, and GAPDH. Total RNA was extracted from treated cells, and cDNA was prepared according to the standard protocols.
Fig. 4.
Fig. 4.
Gadd45a-mediated decrease in the invasive, migratory, and proliferative potential of medulloblastoma cell lines. Approximately 1 × 10⁵ DAOY (A) and 2 × 10⁶ D283 (B) cells treated with ionizing radiation (IR), knockdown (siRNA Gadd45a) or overexpression of Gadd45a (Ov-exp Gadd45a) were suspended in serum-free media and plated onto Matrigel-coated transwell inserts, as described in Materials and Methods. After a 24-hr incubation period, lower invaded cells were stained with HEMA-3. Images of invaded cells were taken under a light microscope (Olympus IX-71). The invasive potential of treated cells was quantified, and the percentage of cells invading from 3 independent experiments are graphically represented as bar diagrams. Error bars represent mean ± SD (*P< .05). (C) Wound healing assay, which is indicative of migration potential of cancer cells, was performed using 80%–85% confluent-treated DAOY cells, as described in Materials and Methods. Photographs were taken using standard 200-μm scale bar. Percent wound repair was calculated from the mean of the average width of the wound obtained from 3 independent experiments and graphically represented as bar diagrams. Error bars represent mean ± SD (P*< .05). (D) Gelatin zymography was performed to determine matrix metallopeptidase (MMP)–9 activity in the conditioned media of the aforementioned treated cells. The intensity of clear halo band of MMP-9 in zymography gels was measured using densitometry and graphically represented, and the error bars represent mean ± SD (P < .05, with IR; P < .01 with control). (E) Clonogenic assay for DAOY cells. The control cells treated with siRNA-Gadd45a, Ov-exp Gadd45a, and in combination with IR treatment were trypsinized to produce single-cell suspension. Approximately 500 cells from each treatment were plated individually in 60-mm plates containing complete media. The plates were incubated for 12 days until they formed sufficiently large colonies. Next, the cells were fixed and stained using HEMA-3 stain. The number of colonies were quantified from 3 independent experiments and are graphically represented as the measure of clonogenecity. Error bars represent mean ± SD (P*< .05).
Fig. 5.
Fig. 5.
Role of Gadd45a in suppression of matrix metallopeptidase (MMP)–9 and epithelial-mesenchymal transition (EMT). The DAOY and D283 cells were treated with pM, with pM + siRNA Gadd45a alone, and with IR treatment (A) and were separately treated with Ov-exp Gadd45a, Ov-exp Gadd45a + rMMP-9 alone and in combination with IR treatment (B). The control cells were treated with scrambled vector (pSV) alone and with IR treatment. Western analysis was done using 40 µg of total lysates from the treated cells to show the levels of Gadd45a, β-catenin, E-cadherin, N-cadherin, and fibronectin. Glyceraldehyde 3-phosphate dehydrogenase (GAPDH) was used as loading control. Gelatin zymography was performed to determine MMP-9 activity using conditioned media from treated samples. (C) Diagramatic representation showing the role of Gadd45a in the negative regulation of MMP-9 induction with IR treatment; the overexpression of Gadd45a accompanied by IR inhibits MMP-9 induction and nuclear translocation of β-catenin. Compared to the control cells and IR treated cells, the downregulation of MMP-9 (pM) or upregulation of Gadd45a (Ov-exp Gadd45a) accompanied by IR shifts the balance towards Gadd45a and thus has significant therapeutic implications.
Fig. 6.
Fig. 6.
Downregulation of MMP-9 (pM) in in vivo tumors increased radioresponse by inducing Gadd45a expression and suppression of epithelial-mesenchymal transition (EMT). Intracerebral tumors were established in nude mice by injecting 1 × 10⁵ DAOY cells. A group of 5 animals was used for each treatment condition (control, IR, pM, and pM + IR). Alzet osmotic pumps (model 2001; Alzet Osmotic Pumps) were implanted into the animals for pM delivery (6–8 mg/kg body weight) followed by IR treatment after 1 week. (A) Brain tissue sections were subjected to hematoxylin and eoisin staining. (B) Immunohistochemical comparison of treated tumor sections using green Alexa Fluor 488 and red Alexa Fluor 594 secondary antibodies for Gadd45a and matrix metallopeptidase (MMP)–9, respectively. (C) Immunohistochemical analysis of the tumor sections to show the levels of EMT markers, N-cadherin (green) and E-cadherin (red). The merged figures are represented here and the individual stained figures are shown in the Supplementary material, Fig. S2. (D) Semiquantification of tumor volume in control, IR, pM, and pM + IR vector-treated groups was done as described in Materials and Methods. Data shown are the mean ± SD values from 3 animals from each group (*P< .005).

Similar articles

Cited by

References

    1. Rutkowski S, Cohen B, Finlay J, et al. Medulloblastoma in young children. Pediatr Blood Cancer. 2010;54:635–637. doi:10.1002/pbc.22372. - DOI - PubMed
    1. Reddick WE, Russell JM, Glass JO, et al. Subtle white matter volume differences in children treated for medulloblastoma with conventional or reduced dose craniospinal irradiation. Magn Reson Imaging. 2000;18:787–793. doi:10.1016/S0730-725X(00)00182-X. - DOI - PubMed
    1. Rutkowski S, Bode U, Deinlein F, et al. Treatment of early childhood medulloblastoma by postoperative chemotherapy alone. N Engl J Med. 2005;352:978–986. doi:10.1056/NEJMoa042176. - DOI - PubMed
    1. Ris MD, Packer R, Goldwein J, Jones-Wallace D, Boyett JM. Intellectual outcome after reduced-dose radiation therapy plus adjuvant chemotherapy for medulloblastoma: a Children's Cancer Group study. J Clin Oncol. 2001;19:3470–3476. - PubMed
    1. Fu KK, Phillips TL. Biologic rationale of combined radiotherapy and chemotherapy. Hematol Oncol Clin North Am. 1991;5:737–751. - PubMed

Publication types

MeSH terms