. 2011 Oct;85(19):10189-200.
doi: 10.1128/JVI.02529-10. Epub 2011 Aug 3.

HLA-DR+ CD38+ CD4+ T lymphocytes have elevated CCR5 expression and produce the majority of R5-tropic HIV-1 RNA in vivo

Affiliations

HLA-DR+ CD38+ CD4+ T lymphocytes have elevated CCR5 expression and produce the majority of R5-tropic HIV-1 RNA in vivo

Amie L Meditz et al. J Virol. 2011 Oct.

Abstract

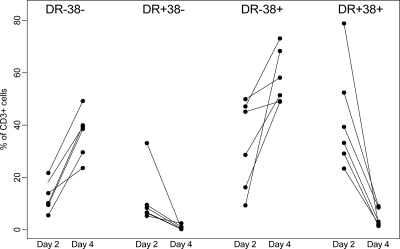
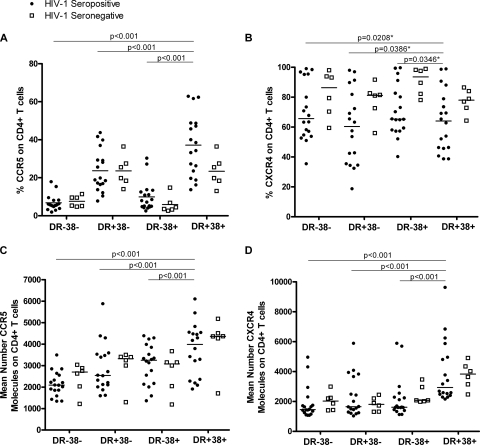
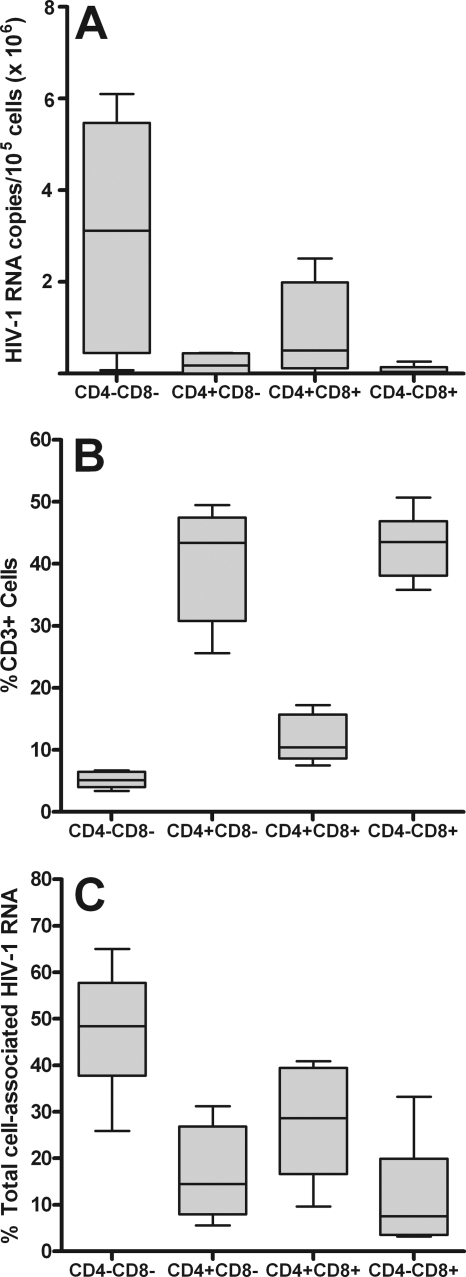
Percentages of activated T cells correlate with HIV-1 disease progression, but the underlying mechanisms are not fully understood. We hypothesized that HLA-DR(+) CD38(+) (DR(+) 38(+)) CD4(+) T cells produce the majority of HIV-1 due to elevated expression of CCR5 and CXCR4. In phytohemagglutinin (PHA)-stimulated CD8-depleted peripheral blood mononuclear cells (PBMC) infected with HIV-1 green fluorescent protein (GFP) reporter viruses, DR(-) 38(+) T cells constituted the majority of CCR5 (R5)-tropic (median, 62%) and CXCR4 (X4)-tropic HIV-1-producing cells (median, 61%), although cell surface CCR5 and CXCR4 were not elevated in this subset of cells. In lymph nodes from untreated individuals infected with R5-tropic HIV-1, percentages of CCR5(+) cells were elevated in DR(+) 38(+) CD4(+) T cells (median, 36.4%) compared to other CD4(+) T-cell subsets (median values of 5.7% for DR(-) 38(-) cells, 19.4% for DR(+) 38(-) cells, and 7.6% for DR(-) 38(+) cells; n = 18; P < 0.001). In sorted CD8(-) lymph node T cells, median HIV-1 RNA copies/10(5) cells was higher for DR(+) 38(+) cells (1.8 × 10(6)) than for DR(-) 38(-) (0.007 × 10(6)), DR(-) 38(+) (0.064 × 10(6)), and DR(+) 38(-) (0.18 × 10(6)) subsets (n = 8; P < 0.001 for all). After adjusting for percentages of subsets, a median of 87% of viral RNA was harbored by DR(+) 38(+) cells. Percentages of CCR5(+) CD4(+) T cells and concentrations of CCR5 molecules among subsets predicted HIV-1 RNA levels among CD8(-) DR/38 subsets (P < 0.001 for both). Median HIV-1 DNA copies/10(5) cells was higher in DR(+) 38(+) cells (5,360) than in the DR(-) 38(-) (906), DR(-) 38(+) (814), and DR(+) 38(-) (1,984) subsets (n = 7; P ≤ 0.031). Thus, DR(+) 38(+) CD4(+) T cells in lymph nodes have elevated CCR5 expression, are highly susceptible to infection with R5-tropic virus, and produce the majority of R5-tropic HIV-1. PBMC assays failed to recapitulate in vivo findings, suggesting limited utility. Strategies to reduce numbers of DR(+) 38(+) CD4(+) T cells may substantially inhibit HIV-1 replication.


Figures

Fig. 1.
Fig. 1.
Representative flow cytometry plot of CD8-depleted PHA-stimulated PBMC 48 h after inoculation with R5-tropic HIV-1 GFP reporter virus. The cells were acquired from the lymphocyte gate of the forward-scatter versus side-scatter profile. The majority of GFP+ tonsil cells were CD4 negative. The cutoff between CD4+ and CD4 cells is indicated by the broken line. CD4+ dim cells were included in the CD4+ gate. Data were analyzed using FlowJo software (Tree Star). pos, positive.
Fig. 2.
Fig. 2.
Percentages of DR/38 lymphocyte subsets in non-virus-producing (GFP) and virus-producing (GFP+) PHA-stimulated PBMC inoculated with R5-tropic (A) and X4-tropic (B) HIV-1 GFP reporter viruses. Mean fluorescence intensity (MFI) of GFP within virus-producing DR/38 subsets of cells inoculated with R5-tropic (C) and X4-tropic (D) HIV-1 reporter viruses. Percentages of GFP+ cells within DR/38 subsets inoculated with R5-tropic (E) and X4-tropic (F) HIV-1 reporter viruses. PBMC from 10 individuals at low risk for HIV-1 infection were depleted of CD8+ cells, cultured for 2 days with PHA and IL-2, inoculated with HIV-1 GFP reporter viruses, and evaluated 48 h later by flow cytometry. For panels A through D, the percentages of DR/38 subsets of cells were determined after first gating on cells in the lymphocyte gate and then on GFP+ and GFP cells. For panels E and F, the percentages of GFP+ cells were determined after first gating on cells in the lymphocyte gate and then on each DR/38 subset. Lines link the values from an individual subject.
Fig. 3.
Fig. 3.
Percentages of CCR5+ (A) and CXCR4+ (C) and cell surface concentrations (B and D) of these receptors, respectively, on DR/38 CD4+ T-cell subsets in whole-blood (WB) samples, PBMC isolated by density centrifugation, and CD8-depleted PHA-stimulated PBMC cultured for 2 days. Peripheral blood samples were obtained from 6 individuals at low risk for HIV-1 infection and stained with antibodies to cell surface markers at each time point, and results were determined by flow cytometry. Chemokine receptor expression on DR/38 subsets was determined after first gating on cells in the lymphocyte gate, then on CD3+ CD4+ cells, and finally on each DR/38 subset. Asterisks indicate the values for PHA-stimulated PBMC that were different from the values for whole blood (P = 0.03 in all instances).
Fig. 4.
Fig. 4.
Percentages of DR/38 CD4+ T-cell subsets in PBMC after 2 and 4 days of culture with PHA. PBMC from 6 individuals at low risk for HIV-1 infection were depleted of CD8+ cells and cultured with PHA. Using flow cytometry, the percentages of DR/38 subsets of cells were determined by first gating on cells in the lymphocyte gate and then on CD3+ CD4+ cells. Lines indicate paired values from one subject. Differences between day 2 and day 4 were significant within all subsets (P = 0.03).
Fig. 5.
Fig. 5.
Representative flow cytometry plots of lymph node cells. The cells were acquired from the lymphocyte gate of the forward- versus side-scatter profile. A dot plot was used to define CD3+ CD4+ cells (A) and gates for CD38 (B) and HLA-DR (C) set with fluorescence minus one (FMO) controls. CD4+ CD3+ lymphocytes were evaluated in a CD38 versus HLA-DR plot (D), and CCR5 expression was evaluated in four DR 38 subsets using histograms (E). Data were analyzed using FlowJo software (Tree Star).
Fig. 6.
Fig. 6.
Percentages of CCR5+ (A) and CXCR4+ (B) and concentrations of these HIV-1 coreceptors (C and D), respectively, in DR/38 CD3+ CD4+ subsets of lymph node cells from HIV-1-seropositive individuals (n = 18) and HIV-1-seronegative individuals (n = 6). Each symbol represents the value for an individual. Short horizontal lines indicate median values for groups of individuals. P values indicate comparisons between DR+ 38+ cells and other subsets in seropositive subjects. Asterisks denote P values that were no longer statistically significant after Bonferroni's correction for multiple comparisons (cutoff, P = 0.017). Differences between DR+ 38+ cells and other subsets in seronegative subjects and differences between seropositive and seronegative subjects were not statistically significant after adjusting for multiple comparisons.
Fig. 7.
Fig. 7.
HIV-1 RNA measurements within subsets of CD4/CD8 CD3+ lymph node cells (n = 6). (A) Numbers of HIV-1 RNA copies/105 cells; (B) percentages of CD4/CD8 subsets within CD8 CD3+ lymph node cells; (C) percentages of total RNA copies contributed by each CD4/CD8 subset after adjusting for percentages of subsets shown in panel B. For each box-and-whisker plot, the line indicates the median and the whiskers (error bars) indicate the range. Lymph node cells from untreated HIV-1-seropositive subjects were sorted into subsets on a cell sorter, and aliquots of 105 cells were frozen as pellets. HIV-1 RNA was then extracted and measured by PCR.
Fig. 8.
Fig. 8.
HIV-1 RNA and DNA measurements within subsets of DR/38 CD8 CD3+ lymph node cells. (A) Numbers of HIV-1 RNA copies/105 cells; (B) percentages of DR/38 subsets within CD8 CD3+ lymph node cells; (C) percentages of total RNA copies contributed by each DR/38 subset after adjusting for percentages of subsets shown in panel B; (D) numbers of HIV-1 DNA copies/105 cells; (E) percentages of total DNA copies contributed by each DR/38 subset after adjusting for percentages of subsets shown in panel B. Lymph node cells from untreated HIV-1-seropositive subjects were sorted into subsets on a cell sorter, and aliquots of 105 cells were frozen as pellets. HIV-1 RNA and DNA were then extracted and measured by PCR.
Fig. 9.
Fig. 9.
Percentage of CCR5+ (A) and number of CCR5 molecules (B) on CD4+ T cells within lymph node cell DR/38 subsets and predicted log10 HIV-1 RNA within the corresponding DR/38 CD8 CD3+ subset.

Similar articles

Cited by

References

    1. Begaud E., et al. 2006. Reduced CD4 T cell activation and in vitro susceptibility to HIV-1 infection in exposed uninfected Central Africans. Retrovirology 3:35. - PMC - PubMed
    1. Biancotto A., et al. 2007. Abnormal activation and cytokine spectra in lymph nodes of people chronically infected with HIV-1. Blood 109:4272–4279 - PMC - PubMed
    1. Biancotto A., et al. 2008. HIV-1 induced activation of CD4+ T cells creates new targets for HIV-1 infection in human lymphoid tissue ex vivo. Blood 111:699–704 - PMC - PubMed
    1. Bleul C. C., Wu L., Hoxie J. A., Springer T. A., Mackay C. R. 1997. The HIV coreceptors CXCR4 and CCR5 are differentially expressed and regulated on human T lymphocytes. Proc. Natl. Acad. Sci. U. S. A. 94:1925–1930 - PMC - PubMed
    1. Chaudhry A., et al. 2009. HIV-1 Nef promotes endocytosis of cell surface MHC class II molecules via a constitutive pathway. J. Immunol. 183:2415–2424 - PMC - PubMed

Publication types