

Coordination of high gamma activity in anterior cingulate and lateral prefrontal cortical areas during adaptation
- PMID: 21813672
- PMCID: PMC6623352
- DOI: 10.1523/JNEUROSCI.1016-11.2011
Coordination of high gamma activity in anterior cingulate and lateral prefrontal cortical areas during adaptation
Abstract
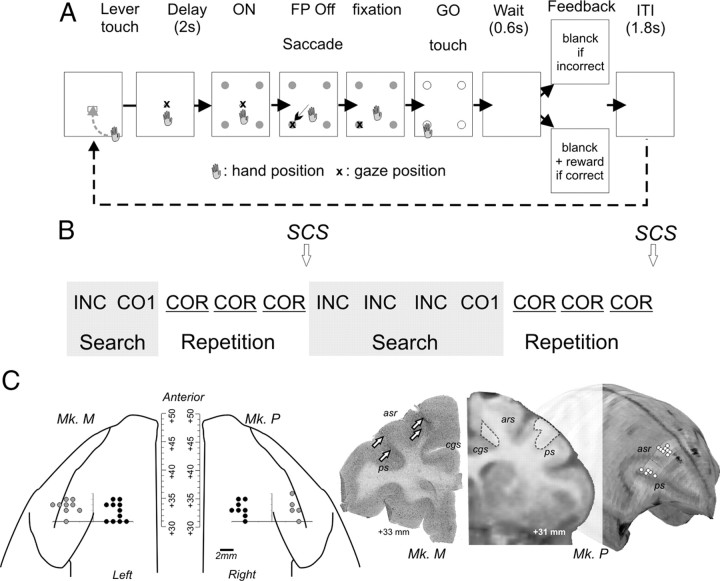
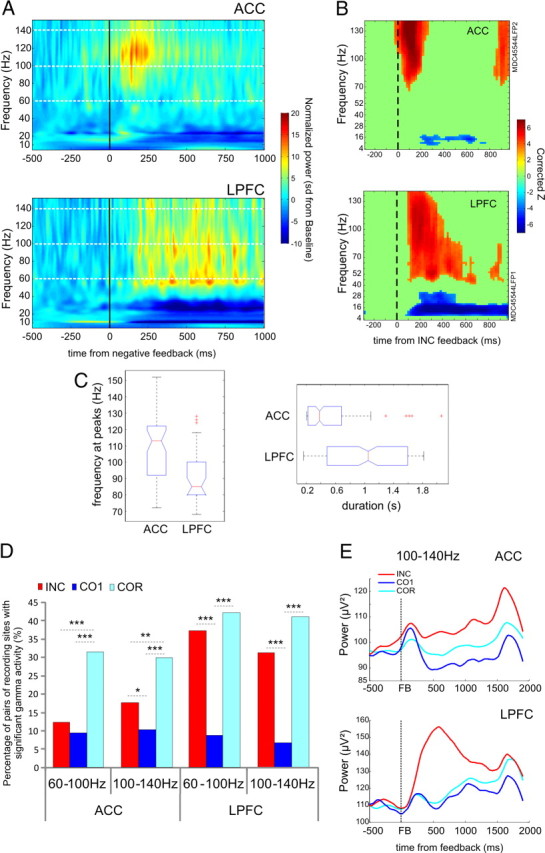
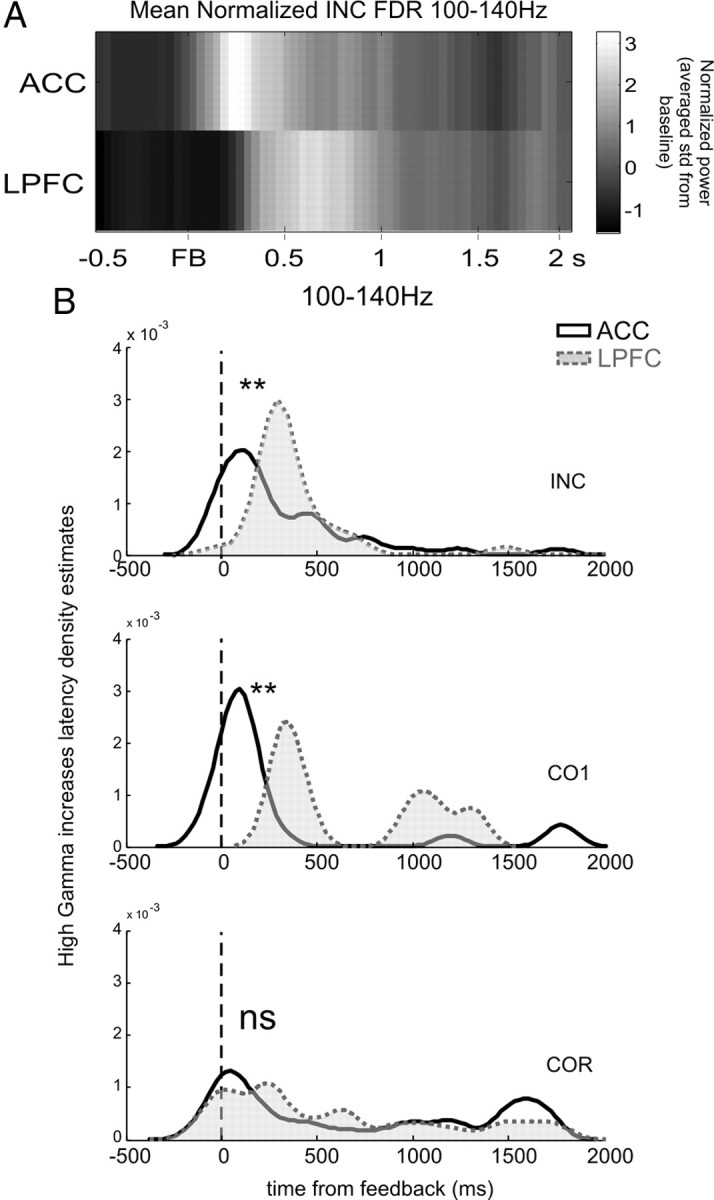
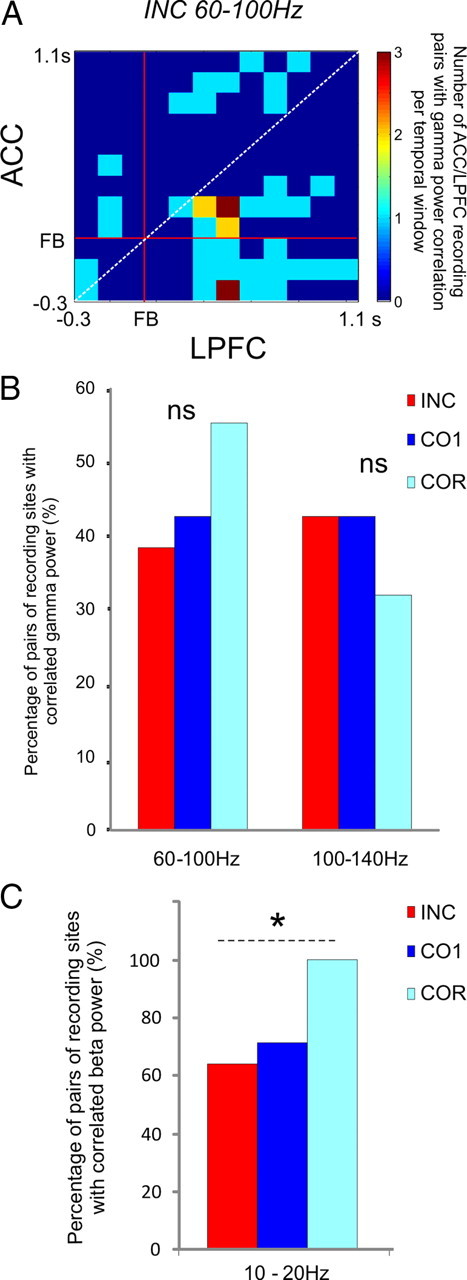
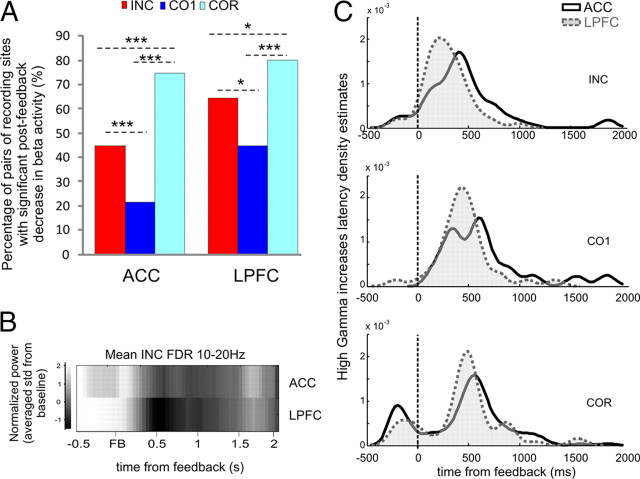
The anterior cingulate cortex (ACC) and the lateral prefrontal cortex (LPFC) process complementary information for planning and evaluating behavior. This suggests at least that processes in these two areas are coordinated during behavioral adaptation. We analyzed local field potentials recorded in both regions in two monkeys performing a problem-solving task that alternated exploration and repetitive behaviors with the specific prediction that neural activity should reveal interareal coordination mainly during exploration. Both areas showed increased high gamma power after errors in exploration and after rewards in exploitation. We found that high gamma (60-140 Hz) power increases in ACC were followed by a later increase in LPFC only after negative feedback (errors) or first positive feedback (correct) during the exploration period. The difference in latencies between the two structures disappeared in repetition period. Simultaneous recordings revealed correlations between high gamma power in the two areas around feedback; however, correlations were observed in both exploration and repetition. In contrast, postfeedback beta (10-20 Hz) power in ACC and LPFC correlated more frequently during repetition. Together, our data suggest that the coordination between ACC and LPFC activity is expressed during adaptive as well as stable behavioral periods but with different modes depending on the behavioral period.
Figures
Similar articles
-
Behavioral Regulation and the Modulation of Information Coding in the Lateral Prefrontal and Cingulate Cortex.Cereb Cortex. 2015 Sep;25(9):3197-218. doi: 10.1093/cercor/bhu114. Epub 2014 Jun 5. Cereb Cortex. 2015. PMID: 24904073
-
Asymmetric effective connectivity between primate anterior cingulate and lateral prefrontal cortex revealed by electrical microstimulation.Brain Struct Funct. 2019 Mar;224(2):779-793. doi: 10.1007/s00429-018-1806-y. Epub 2018 Dec 1. Brain Struct Funct. 2019. PMID: 30506457
-
Strength and Diversity of Inhibitory Signaling Differentiates Primate Anterior Cingulate from Lateral Prefrontal Cortex.J Neurosci. 2017 May 3;37(18):4717-4734. doi: 10.1523/JNEUROSCI.3757-16.2017. Epub 2017 Apr 5. J Neurosci. 2017. PMID: 28381592 Free PMC article.
-
Interneuron-specific gamma synchronization indexes cue uncertainty and prediction errors in lateral prefrontal and anterior cingulate cortex.Elife. 2021 Jun 18;10:e69111. doi: 10.7554/eLife.69111. Elife. 2021. PMID: 34142661 Free PMC article.
-
Mistakes were made: neural mechanisms for the adaptive control of action initiation by the medial prefrontal cortex.J Physiol Paris. 2015 Feb-Jun;109(1-3):104-17. doi: 10.1016/j.jphysparis.2014.12.001. Epub 2015 Jan 28. J Physiol Paris. 2015. PMID: 25636373 Free PMC article. Review.
Cited by
-
Specific frontal neural dynamics contribute to decisions to check.Nat Commun. 2016 Jun 20;7:11990. doi: 10.1038/ncomms11990. Nat Commun. 2016. PMID: 27319361 Free PMC article.
-
Frontal theta as a mechanism for cognitive control.Trends Cogn Sci. 2014 Aug;18(8):414-21. doi: 10.1016/j.tics.2014.04.012. Epub 2014 May 15. Trends Cogn Sci. 2014. PMID: 24835663 Free PMC article. Review.
-
Neural structures underlying set-shifting: roles of medial prefrontal cortex and anterior cingulate cortex.Behav Brain Res. 2013 Aug 1;250:91-101. doi: 10.1016/j.bbr.2013.04.037. Epub 2013 May 9. Behav Brain Res. 2013. PMID: 23664821 Free PMC article. Review.
-
Modulation of feedback-related negativity during trial-and-error exploration and encoding of behavioral shifts.Front Neurosci. 2013 Nov 14;7:209. doi: 10.3389/fnins.2013.00209. eCollection 2013. Front Neurosci. 2013. PMID: 24294190 Free PMC article.
-
Adaptive Encoding of Outcome Prediction by Prefrontal Cortex Ensembles Supports Behavioral Flexibility.J Neurosci. 2017 Aug 30;37(35):8363-8373. doi: 10.1523/JNEUROSCI.0450-17.2017. Epub 2017 Jul 20. J Neurosci. 2017. PMID: 28729442 Free PMC article.
References
-
- Aston-Jones G, Cohen JD. An integrative theory of locus coeruleus–norepinephrine function: adaptive gain and optimal performance. Annu Rev Neurosci. 2005;28:403–450. - PubMed
-
- Averbeck BB, Sohn JW, Lee D. Activity in prefrontal cortex during dynamic selection of action sequences. Nat Neurosci. 2006;9:276–282. - PubMed
Publication types
MeSH terms
LinkOut - more resources
Full Text Sources