. 2011 Aug 3;31(31):11133-43.
doi: 10.1523/JNEUROSCI.0661-11.2011.

Visual-induced excitation leads to firing pauses in striatal cholinergic interneurons

Affiliations

Visual-induced excitation leads to firing pauses in striatal cholinergic interneurons

Jan M Schulz et al. J Neurosci. .

Abstract

Tonically active neurons in the primate striatum, believed to be cholinergic interneurons (CINs), respond to sensory stimuli with a pronounced pause in firing. Although inhibitory and neuromodulatory mechanisms have been implicated, it is not known how sensory stimuli induce firing pauses in CINs in vivo. Here, we used intracellular recordings in anesthetized rats to investigate the effectiveness of a visual stimulus at modulating spike activity in CINs. Initially, no neuron was visually responsive. However, following pharmacological activation of tecto-thalamic pathways, the firing pattern of most CINs was significantly modulated by a light flashed into the contralateral eye. Typically, this induced an excitation followed by a pause in spike firing, via an underlying depolarization-hyperpolarization membrane sequence. Stimulation of thalamic afferents in vitro evoked similar responses that were independent of synaptic inhibition. Thus, visual stimulation likely induces an initial depolarization via a subcortical tecto-thalamo-striatal pathway, pausing CIN firing through an intrinsic afterhyperpolarization.


Figures

Figure 1.
Figure 1.
Electrophysiological properties of CINs. a, Membrane potential response to a positive and a negative current step in a CIN. Note the characteristic sag in the hyperpolarizing membrane potential response that depends on the hyperpolarization and cyclic nucleotide-activated cation current (IH), and the AHP response after a depolarizing current injection. The inset shows the current–voltage relationship; the input resistance was derived from the slope of the regression line. b, Merged Z-projections from confocal image stacks of the same neuron. The fusiform soma is oriented along the Z-plane and appears round.
Figure 2.
Figure 2.
Relationship between spontaneous spiking in CINs and slow-wave ECoG activity. a1–a3, Seven-second-long segments of intracellular and simultaneous ECoG activity from a continuous recording of 90 s for three CINs (numbered 1–3). Note the different activity patterns across neurons, ranging from phasic (top) and irregular (middle) to regular spiking (bottom). b1–b3, Distributions of ISIs and CV2 values for the whole 90 s of the same recordings as in a1–a3. The median ISI is indicated (dashed line). c1–c3, Membrane potential distribution (top) and cross-correlograms between ECoG and subthreshold membrane potential fluctuations (bottom) for the same three CINs.
Figure 3.
Figure 3.
Coherence between spiking in CINs and ECoG correlates with spiking irregularity. a, The STA of the ECoG (black) for the same neurons as in Figure 2. The STA had a peak around zero that exceeded chance level (gray traces), indicating that spike times were significantly correlated to ECoG activity in all three neurons. b, Spike–ECoG coherence plotted on a double-logarithmic scale. c, The log-transformed peak value of the spike–ECoG coherence at frequencies <3 Hz was significantly correlated to the mean CV2 value across neurons.
Figure 4.
Figure 4.
Effects of BIC ejection into the SC on spontaneous activity. a, Immediate effects on spontaneous activity in a CIN (top), cortex (middle), and SC (bottom) were already obvious during BIC ejection into the SC. b, Across the whole recording, the mean spike rate was increased in six neurons and significantly decreased in the seventh neuron after BIC. c, The mean CV2 changed significantly in five neurons. Significant changes (p < 0.05, Wilcoxon's rank sum test) are indicated by filled circles and thick lines. Data from individual neurons have the same symbols and gray shade in all panels. d, A scatter plot of mean CV2 versus mean spike rate. Before and after values from the same neuron are connected by a line. CV2 values were significantly correlated with mean spike rates (dashed line; p = 0.0042). e, Overall minimal ISI before and after BIC. Note that the minimal ISI was never smaller than 10 ms (dashed line) despite spike rate increases after BIC.
Figure 5.
Figure 5.
Effect of BIC ejection into the SC on single-trial spike responses in one example experiment (09410n1). Times of action potentials are shown for single trials over the course of the whole experiment in a raster plot (b). The time of BIC ejection is indicated by a horizontal line at zero on the y-axis. All trials are aligned to the light flash (dashed vertical line at zero on the x-axis). Peri-light-flash time histograms show the light induced spike-rate modulation before (a) and after BIC (c). The mean prelight spike rate (horizontal gray line) ± 2*SD (dashed lines) are indicated. d, VEP amplitude measured in the SC.
Figure 6.
Figure 6.
Representative examples of visual membrane potential responses by the same example neurons after BIC. Single light trials are aligned to the light flash onset (dashed vertical line). Scale of membrane potential fluctuations is the same for all neurons; action potentials have been truncated. The mean membrane potential trajectory across all light trials after BIC is also indicated (blue; lighter shade indicates SEM). The negative deflection in the local field potential recording from the SC marks the VEP. The insets show the spike raster plots for 10 consecutive light trials (for neuron 09410n1, see Fig. 5). Note the variability in number and timing of action potentials between neurons.
Figure 7.
Figure 7.
Mean modulation of spike rate, time-resolved CV2, and membrane potential induced by light flash stimulation before and after BIC ejection into the SC. Each trace is aligned to the light flash at zero (vertical dashed line). Mean responses of the three example neurons after BIC are shown in the first row. For CV2 and membrane potential, times of significant deviations from baseline are indicated by colored dots (p < 0.001; Wilcoxon's signed rank test). Note that the time course of light-evoked modulations varied largely between neurons. The grand means (7 neurons) for responses before and after BIC ejection are shown in the second and third rows, respectively. The lighter shades indicate the SEM. The dotted lines indicate 2 SD from prelight mean.
Figure 8.
Figure 8.
Stimulation of thalamo-striatal afferents evokes excitatory PSPs and spike–pause responses in CINs in vitro. a, Characteristics of thalamo-striatal PSPs. Single stimulation within the thalamus or the internal capsule evoked depolarizing PSPs in CINs that were resistant to 50 μm APV but were blocked by 10 μm CNQX. Single neuron example of PSP amplitudes (averages of 6 traces recorded at a 5 ms interval), illustrating the effect of application of AP5 and CNQX. Representative traces of 1 min averages at the time points a, b, and c are indicated. Calibration: 1.5 mV, 50 ms. Right, Average responses following 3–5 min of drug application (normalized to the mean control PSP amplitude) showed that the PSP was blocked by 93% by CNQX (n = 4; ***p < 0.001, one-way ANOVA and Dunnett's post hoc analysis). Error bars indicate SEM. b, Raster plots and PSTHs from an example experiment show that PSPs evoked by repetitive stimulation (66–100 Hz), but not by one to two stimuli were sufficient to induce a spike–pause response in CINs. c, The grand mean (6 neurons) of spike-rate modulation, time-resolved CV2, and membrane potential induced by four thalamo-striatal stimuli. Note the consistent induction of a spike–pause response and underlying PSP–AHP sequence. d, Raster plots and PSTHs from an example experiment show that spike–pause responses to thalamo-striatal PSPs persisted in the presence of the GABA antagonists gabazine and CGP55845, and with the further addition of the NMDA receptor antagonist AP5.
Figure 9.
Figure 9.
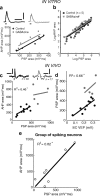
PSP and AHP area are correlated in in vitro and in vivo experiments. a, Representative example of a scatter plot of AHP versus PSP area measurements in the absence and presence of GABA antagonists gabazine and CGP55845 in subthreshold trials in vitro. Data points are mean areas of episodes grouped by the number of stimuli in a train. Average traces for each condition are shown above for four stimuli. Calibration: 3 mV, 200 ms. b, Group analysis of in vitro experiments with subthreshold PSPs show that the correlation between PSP and AHP persisted in the presence of GABA antagonists that appeared to enhance the AHP (mixed-model regression, *p < 0.05). c, Scatter plot of AHP versus PSP parameters of subthreshold visual responses from trials without AP discharge in two in vivo experiments. The filled circles represent measurements on averages of four episodes. The insets show the mean response. Calibration: 2 mV, 1 s. The time of the light flash and number included individual trials are indicated. The R2 value indicates the correlation in one experiment (*p < 0.05). d, PSP area was positively correlated to collicular response strength in the subthreshold responses of one neuron. e, The circles represent the mean visual responses of the group of spontaneously active neurons in vivo. There was a significant correlation between AHP area and PSP area.
Figure 10.
Figure 10.
A model of the pathways involved in mediating visual responses in cholinergic interneurons. Tecto-thalamic inputs directly drive spike–pause responses in CINs when they are sufficiently strong (e.g., after BIC ejection into the SC in the current study). Simultaneous responses in CINs and DA neurons can interact to modulate information processing in the striatum.

References

    1. Aosaki T, Graybiel AM, Kimura M. Effect of the nigrostriatal dopamine system on acquired neural responses in the striatum of behaving monkeys. Science. 1994;265:412–415. - PubMed
    1. Aosaki T, Kiuchi K, Kawaguchi Y. Dopamine D1-like receptor activation excites rat striatal large aspiny neurons in vitro. J Neurosci. 1998;18:5180–5190. - PMC - PubMed
    1. Bennett BD, Wilson CJ. Spontaneous activity of neostriatal cholinergic interneurons in vitro. J Neurosci. 1999;19:5586–5596. - PMC - PubMed
    1. Bennett BD, Callaway JC, Wilson CJ. Intrinsic membrane properties underlying spontaneous tonic firing in neostriatal cholinergic interneurons. J Neurosci. 2000;20:8493–8503. - PMC - PubMed
    1. Blomeley C, Bracci E. Excitatory effects of serotonin on rat striatal cholinergic interneurones. J Physiol. 2005;569:715–721. - PMC - PubMed

Publication types

MeSH terms

LinkOut - more resources