. 2011 Aug 3;31(31):11159-71.
doi: 10.1523/JNEUROSCI.6209-10.2011.

Distinct and non-redundant roles of microglia and myeloid subsets in mouse models of Alzheimer's disease

Affiliations

Distinct and non-redundant roles of microglia and myeloid subsets in mouse models of Alzheimer's disease

Alexander Mildner et al. J Neurosci. .

Abstract

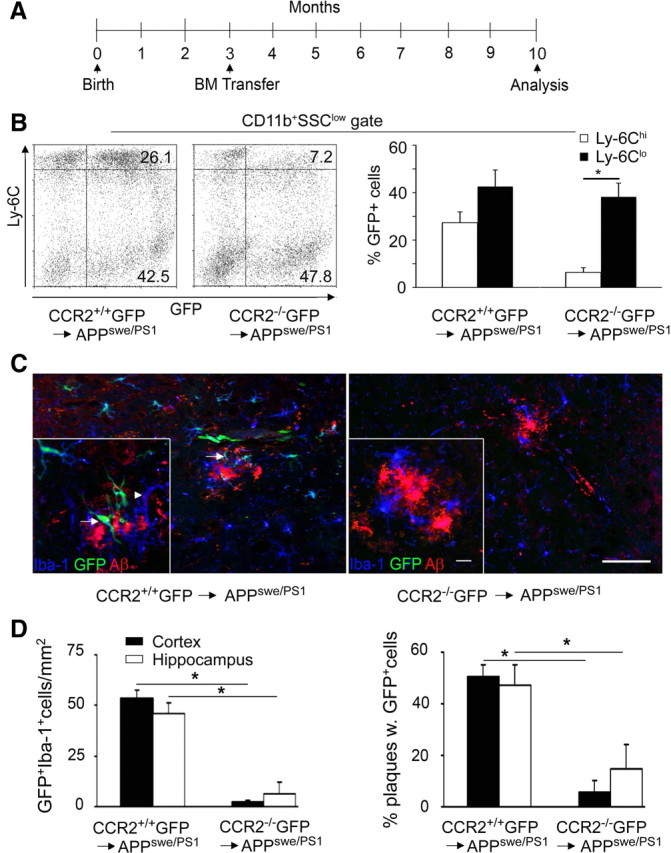
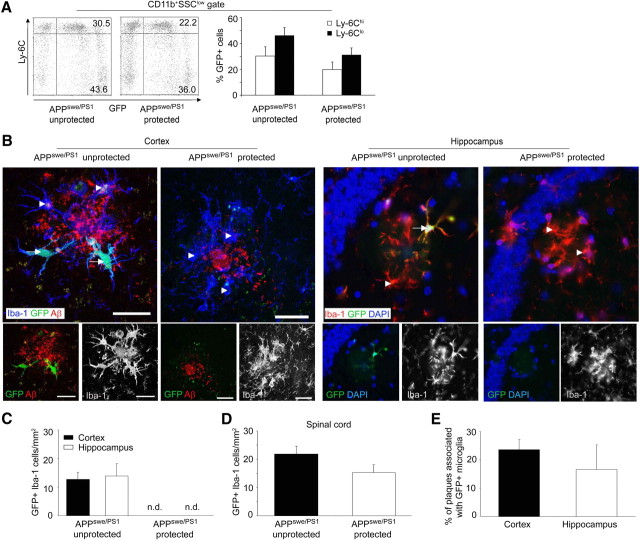
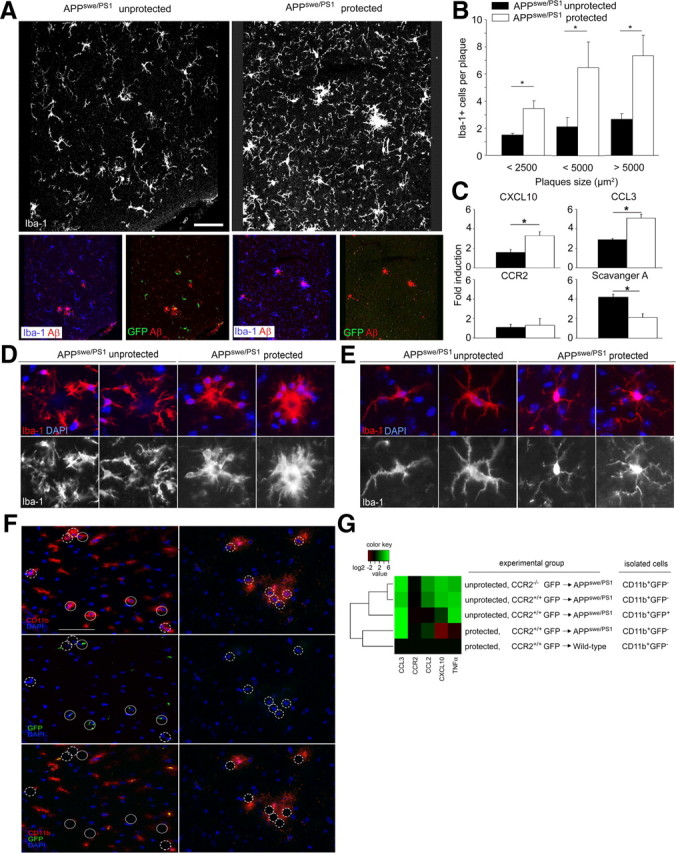
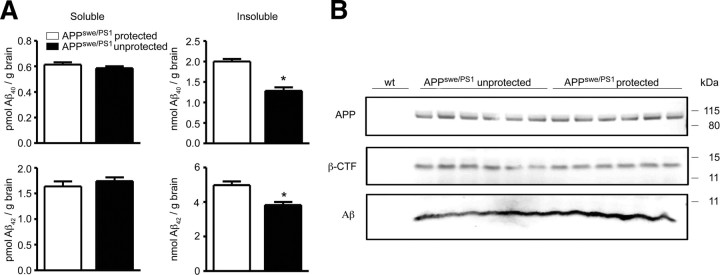
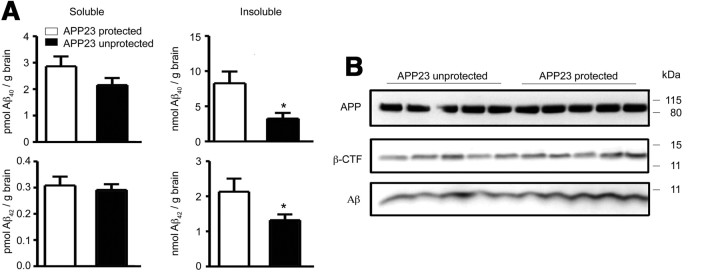
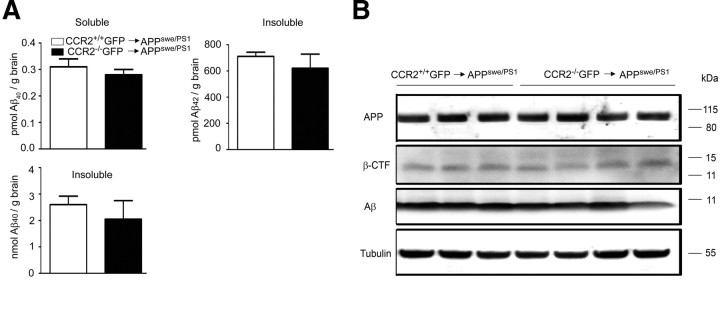
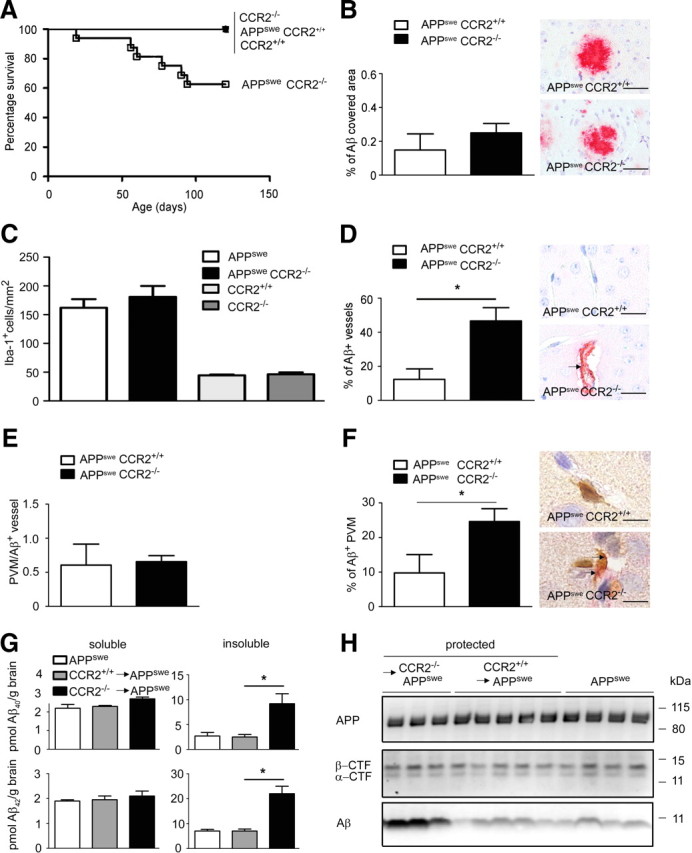
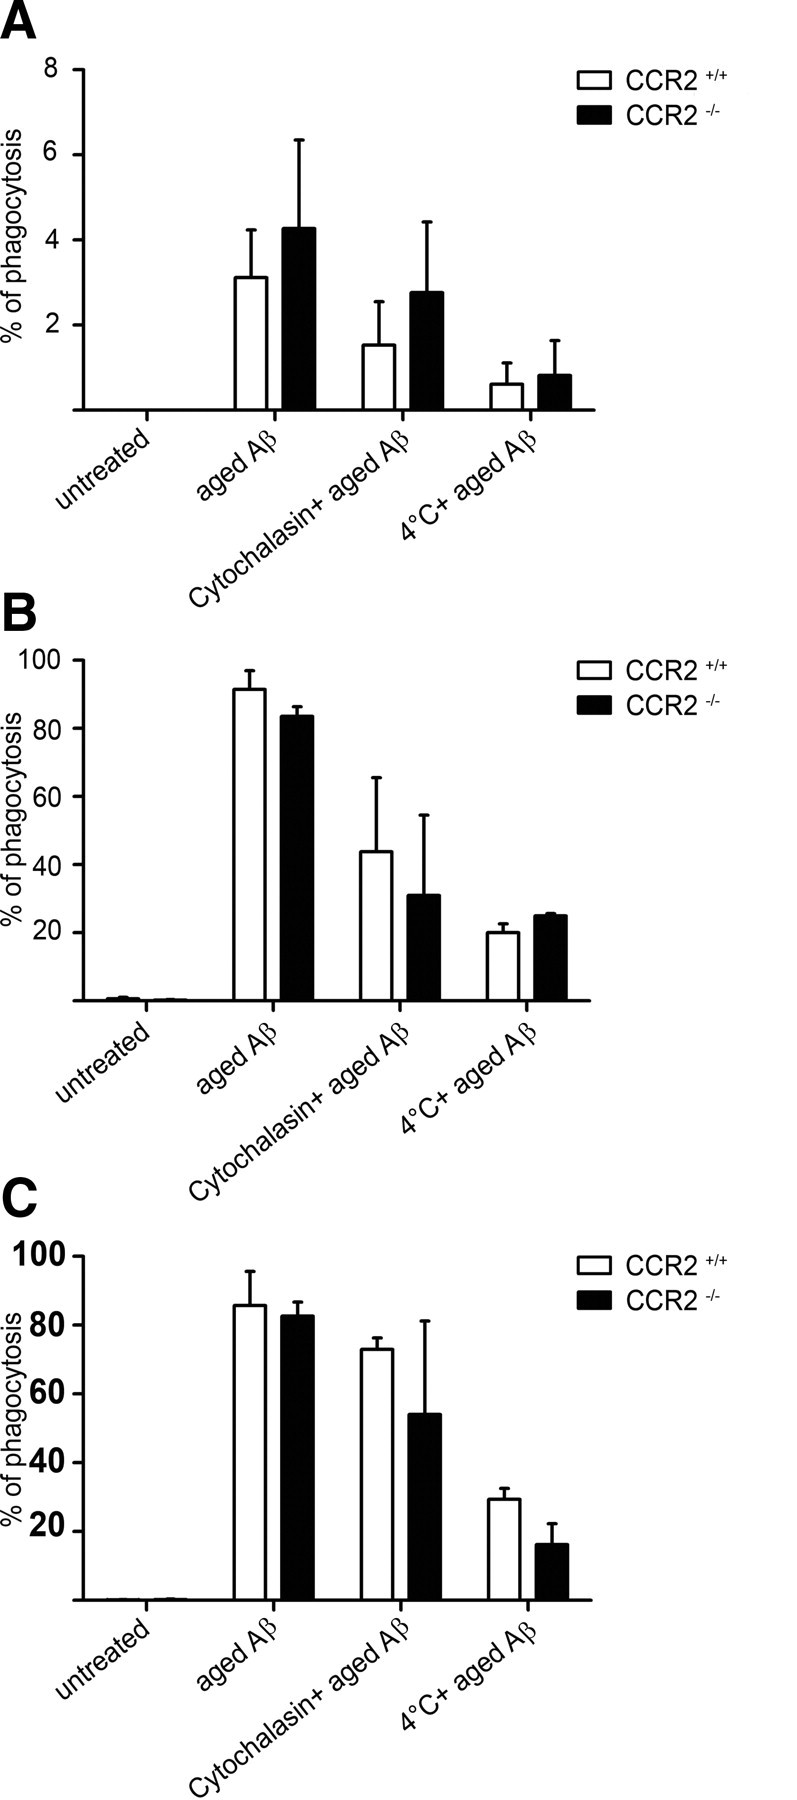
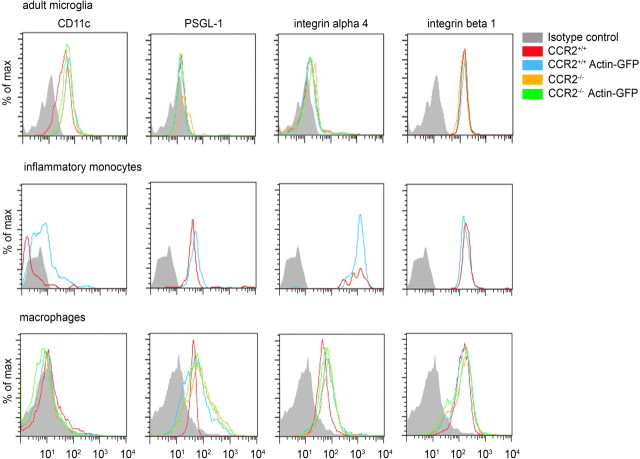
Mononuclear phagocytes are important modulators of Alzheimer's disease (AD), but the specific functions of resident microglia, bone marrow-derived mononuclear cells, and perivascular macrophages have not been resolved. To elucidate the spatiotemporal roles of mononuclear phagocytes during disease, we targeted myeloid cell subsets from different compartments and examined disease pathogenesis in three different mouse models of AD (APP(swe/PS1), APP(swe), and APP23 mice). We identified chemokine receptor 2 (CCR2)-expressing myeloid cells as the population that was preferentially recruited to β-amyloid (Aβ) deposits. Unexpectedly, AD brains with dysfunctional microglia and devoid of parenchymal bone marrow-derived phagocytes did not show overt changes in plaque pathology and Aβ load. In contrast, restriction of CCR2 deficiency to perivascular myeloid cells drastically impaired β-amyloid clearance and amplified vascular Aβ deposition, while parenchymal plaque deposition remained unaffected. Together, our data advocate selective functions of CCR2-expressing myeloid subsets, which could be targeted specifically to modify disease burden in AD.


Conflict of interest statement

The authors declare no conflict of interest.

Figures

Figure 1.
Figure 1.
Engraftment of BM-derived phagocytes in the brains of AD transgenic mice depends on CCR2. A, Time scale of BM transfer experiments performed in APPswe/PS1 animals. Arrows mark the time points of generation and subsequent analysis of CCR2+/+GFPAPPswe/PS1 and CCR2−/−GFPAPPswe/PS1 chimeric mice. B, FACS analysis of peripheral blood 10 months after BM cell transfer reveals a lack of GFP+Ly-6Chi monocytes in CCR2−/−GFPAPPswe/PS1 chimeras compared with CCR2+/+ GFP donors. Percentages of the respective cell populations are indicated. Representative dot blots for the chimeric groups (left) and quantification of GFP+CD11b+Ly-6Chi and GFP+CD11b+Ly-6Clo cells (right) are shown. Data are expressed as means ± SEM. SSC, Side scatter. At least 5 mice per group were assessed. *p < 0.05 statistical significance. C, Immunohistochemistry of APPswe/PS1 BM chimeric brains. Fluorescence microscopy reveals a significant number of GFP-positive ramified cells in the hippocampus of CCR2+/+GFPAPPswe/PS1 mice (left), but very few in CCR2−/−GFPAPPswe/PS1 mice (right). Iba-1 immunoreactivity (blue) for phagocytes shows that some branched cells are GFP+ and therefore of donor origin (GFP, green, arrows), whereas others represent endogenous microglia expressing only Iba-1 (arrowheads). Immunostaining of β-amyloid is shown in red. Scale bars: 100 μm (overviews) and 25 μm (insets). D, Semiquantitative analysis of phagocyte engraftment (GFP+Iba-1+ cells) per area (left) and per β-amyloid plaque (right) in the hippocampus and cortex of BM chimeric animals. Bars show the means ± SEM from at least three sections per individual animal (n ≥ 5 per group). *p < 0.05 statistical significance.
Figure 2.
Figure 2.
CNS conditioning enhances the recruitment of BM-derived mononuclear phagocytes into the brains of AD transgenic mice. A, Assessment of blood chimerism in brain-protected and unprotected CCR2+/+GFPAPPswe/PS1 chimeras. Representative dot plots from individual mice are shown on the left, and the percentages of GFP+CD11b+Ly-6Clo and GFP+CD11b+Ly-6Chi cells are indicated. SSC, Side scatter. Quantification of Ly-6Clo- and Ly-6Chi-expressing GFP-positive cells in the peripheral blood of unprotected and protected CCR2+/+GFPAPPswe/PS1 BM chimeras is shown on the right. Data are means ± SEM. At least 5 mice per group were examined. B, Phagocyte engraftment from the hematopoietic compartment requires irradiation of the brains of AD transgenic mice. Ramified GFP- and Iba-1-expressing cells were examined 7 months after BMC transfer. Immunohistochemistry for Iba-1 (blue, left; red, right), Aβ deposits (red), GFP fluorescence (green), and DAPI staining of nuclei (blue) in cortical and hippocampal sections from unprotected and protected CCR2+/+GFPAPPswe/PS1 BM chimeras reveals that BM-derived (GFP+) Iba-1+ mononuclear phagocytes (arrows) are exclusively found in unprotected AD brains, whereas nonirradiated (protected) brains are devoid of parenchymal ramified GFP+ cells. Endogenous host microglia are Iba-1+GFP (arrowheads). Scale bars, 30 μm. C–E, Semiquantitative analysis of regional myeloid cell engraftment (GFP+Iba-1+ cells) in the brain (cortex and hippocampus) (C) and spinal cord (D) of total-body irradiated (unprotected) and brain-shielded (protected) CCR2+/+GFPAPPswe/PS1 BM chimeras. Engraftment of BM-derived mononuclear cells strictly depends on irradiation of the nervous tissue in AD transgenic mice. The percentage of plaques surrounded by GFP+ mononuclear cells in the conditioned brains is shown in E. Data are means ± SEM from at least three sections per animal and at least 5 mice per group. n.d., Not detectable.
Figure 3.
Figure 3.
Irradiation changes the network of microglia, alters their morphology, and shapes the local inflammatory milieu. A, Iba-1 immunoreactivity (white) reveals dramatic changes of the microglia network upon irradiation in unprotected CCR2+/+GFPAPPswe/PS1 BM chimeras compared with protected chimeras (top row). Only unprotected CCR2+/+GFPAPPswe/PS1 BM chimeras (APPswe/PS1 unprotected) contain GFP+ (green) Iba-1-immunoreactive (blue) phagocytes, which partially surround Aβ plaques (red) (bottom row). B, Quantification of Iba-1+ cells per β-amyloid plaque indicates a significant reduction of plaque-associated Iba-1+ microglia/macrophages in unprotected CCR2+/+GFPAPPswe/PS1 BM chimeras (APPswe/PS1 unprotected, black bars) compared with protected chimeras (APPswe/PS1 protected, white bars) independent of the plaque size. Data are means ± SEM from at least three sections per animal and at least 5 mice per group. *p < 0.05 statistical significance. C, Quantitative real-time PCR analysis of CXCL10, CCL3, CCR2, and scavenger A mRNA expression in the brains of unprotected CCR2+/+GFPAPPswe/PS1 BM chimeras (black bars) compared with protected chimeras (white bars). Data are means ± SEM from at least 5 mice animals per group. *p < 0.05 statistical significance. D, Morphology of microglia/macrophages surrounding β-amyloid plaques in the brain. In unprotected CCR2+/+GFPAPPswe/PS1 BM chimeras (APPswe/PS1 unprotected), Iba-1-immunoreactive microglia/macrophages (red) are dystrophic and dissociated from the plaque (left). In contrast, Iba-1+ microglia/macrophages in protected CCR2+/+GFPAPPswe/PS1 BM chimeras (APPswe/PS1 protected) cluster in and around the plaque and extend cellular protrusions into the core of the plaque (right). Nuclear DAPI staining in blue. E, Morphology of Iba-1-immunoreactive microglia/macrophages in the brain at sites distant from β-amyloid deposits. In unprotected CCR2+/+GFPAPPswe/PS1 BM chimeras (left), Iba-1-immunoreactive microglia/macrophages (red) have enlarged cell bodies with short and spiny processes compared with the protected condition (right). Nuclear DAPI staining in blue. F, Laser microdissection of CD11b+GFP endogenous microglia and CD11b+GFP+ engrafted macrophages from the hippocampus of unprotected and protected CCR2+/+GFPAPPswe/PS1 BM chimeras. Nuclear staining with DAPI is shown in blue, CD11b immunoreactivity in red (top), and GFP expression in green (middle). The bottom shows the overlay and indicates the results of microdissection. Closed circles indicate dissected endogenous microglia (CD11b+GFP); dashed circles indicate BM-derived macrophages (CD11b+GFP+). Scale bar, 50 μm. G, Quantification of cytokine and chemokine mRNA expression in microdissected CD11b+GFP and CD11b+GFP+ microglia/macrophages under different experimental conditions. Data are presented as a heat map with a log2 scale (brown, downregulated; green, upregulated). Rows indicate experimental groups; columns represent particular genes. Each data point reflects the median expression value of a particular gene resulting from three to four individual mice, normalized to the mean expression value of the respective gene in CD11b+GFP cells from protected wild-type recipients.
Figure 4.
Figure 4.
Absence of cell death and proliferation in the brain following irradiation and bone marrow transplantation. Tissue sections from the CNS of chimeric mice were stained at indicated time points after irradiation and BM transfer with antibodies against Ki-67 (TEC-3, DAKO, 1:20) and BrdU (in situ Detection Kit, BD PharMingen) for proliferation and TUNEL (Roche) for apoptotic cells. Spleens of chimeric mice were used as positive controls (insets). Representative pictures (cerebellum) from each experimental group (n = 2–3 mice) are shown.
Figure 5.
Figure 5.
Aβ deposition is reduced in AD transgenic mice after brain irradiation and BMC transplantation. A, Determination of the amounts of soluble and insoluble Aβ1–40 and Aβ1–42 by sandwich ELISA in brain lysates from protected (white bars) and unprotected (black bars) CCR2+/+GFPAPPswe/PS1 BM chimeras 7 months after irradiation. Deposition of insoluble, but not soluble Aβ1–40 and Aβ1–42 is significantly reduced in unprotected (brain-irradiated) CCR2+/+GFPAPPswe/PS1 BM chimeras. Data are means ± SEM from at least 5 mice per group. *p < 0.05 statistical significance. B, Immunoblot analysis of brain lysates from unprotected and protected CCR2+/+GFPAPPswe/PS1 BM chimeras for APP, β-CTF, and Aβ. No differences in APP processing were found between protected and unprotected animals (n = 6 per group). Wild-type mice (wt) served as negative controls.
Figure 6.
Figure 6.
Aβ deposition is reduced in AD transgenic mice after brain irradiation and BM transplantation. A, Determination of the amounts of soluble and insoluble Aβ1–40 and Aβ1–42 by sandwich ELISA in brain lysates from protected (white bars) and unprotected (black bars) CCR2+/+GFPAPP23 BM chimeras. Deposition of insoluble, but not soluble Aβ1–40 and Aβ1–42 is significantly reduced in unprotected (brain-irradiated) CCR2+/+GFPAPP23 BM chimeras. Data are means ± SEM from 5 mice per group. *p < 0.05 statistical significance. B, Immunoblot analysis of brain lysates from unprotected and protected CCR2+/+ GFPAPP23 BM chimeras for APP, β-CTF, and Aβ. No differences in APP processing were found between protected and unprotected animals (n = 5 per group).
Figure 7.
Figure 7.
Parenchymal Aβ load in the brains of AD transgenic mice is independent from the presence of immigrating bone marrow-derived phagocytes. A, Determination of the amounts of soluble and insoluble Aβ1–40 and Aβ1–42 by sandwich ELISA in brain lysates from unprotected (brain-irradiated) CCR2+/+GFPAPPswe/PS1 (white bars) and CCR2−/−GFPAPPswe/PS1 (black bars) BM chimeric mice. Aβ deposition is independent of the engraftment of donor-derived phagocytes in the brain, which is significantly reduced in CCR2−/−GFPAPPswe/PS1 BM chimeras (see also Fig. 1C,D). B, Immunoblot analysis of brain lysates from CCR2+/+GFPAPPswe/PS1 and CCR2−/−GFPAPPswe/PS1 BM chimeric mice for APP, β-CTF, and Aβ. No differences in APP processing were found between the groups (n = 3–4 per group). Tubulin served as loading control.
Figure 8.
Figure 8.
Perivascular macrophages in AD transgenic mice clear Aβ in a CCR2-dependent manner. A, Expression of CCR2 determines the survival of APPswe mice. Survival curves of wild-type CCR2+/+, CCR2−/−, APPswe CCR2+/+, and APPswe CCR2−/− mice are shown. In each experimental group at least 20 mice were used. B, Immunohistochemistry with an antibody against Aβ reveals no difference in the relative area covered by Aβ in the cortex of APPswe CCR2+/+ and APPswe CCR2−/− mice. Data are means ± SEM from at least 3 sections per animal and at least 3 mice per group. Representative immunostained sections are shown on the right. Scale bars, 100 μm. C, Semiquantitative analysis of Iba-1-immunoreactive cells in the brain reveals normal proliferation of microglia in the absence of CCR2. The number of Iba-1+ microglia/macrophages is significantly increased in the brains of APPswe CCR2+/+ (white bar, n = 4) and APPswe CCR2−/− mice (black bar, n = 4) compared with CCR2+/+ (light gray bar, n = 3) and CCR2−/− mice (dark gray bar, n = 4), respectively. The number of Iba-1+ cells is not different between APPswe CCR2+/+ and APPswe CCR2−/− mice, or between CCR2+/+ and CCR2−/− mice. Data are means ± SEM from at least 3 sections per animal and at least 3 mice per group. D, Immunohistochemistry with an antibody against Aβ reveals a significant increase in the percentage of blood vessels containing β-amyloid in the cortex of APPswe CCR2−/− compared with APPswe CCR2+/+ mice. Data are means ± SEM from at least 3 sections per animal and at least 3 mice per group. Asterisk indicates statistical significance (p < 0.05). Representative immunostained sections are shown on the right, and the arrow indicates vascular Aβ accumulation. Scale bars, 50 μm. E, Absence of CCR2 does not change the number of Iba-1+ PVMs per Aβ-containing blood vessel. Semiquantitative analysis reveals the same number of PVMs in APPswe CCR2+/+ as in APPswe CCR2−/− mice. Data are means ± SEM from at least 3 sections per animal and at least 3 mice per group. F, CCR2 deficiency increases the percentage of perivascular macrophages, which accumulate Aβ. Semiquantitative analysis was performed on at least 3 sections per animal and at least 3 mice per group (APPswe CCR2+/+ and APPswe CCR2−/− mice). Data are means ± SEM. *p < 0.05 statistical significance. Representative immunostained sections are shown on the right. Aβ+Iba-1+ PVMs were visualized by double immunohistochemistry (Aβ in red, Iba-1 in brown). The arrows point to aβ deposition in PVMs. Scale bars, 20 μm. G, Determination of the amounts of soluble and insoluble Aβ1–40 and Aβ1–42 by sandwich ELISA in brain lysates from nontransplanted APPswe mice (white bars), and from protected, i.e., brain shielded from irradiation, CCR2+/+GFPAPPswe (gray bars) and CCR2−/−GFPAPPswe (black bars) BM chimeric mice 7 months after transplantation. Deposition of insoluble, but not soluble Aβ1–40 and Aβ1–42 is significantly increased in APPswe mice transplanted with CCR2-deficient BMCs. Data are means ± SEM from at least 3 mice per group. *p < 0.05 statistical significance. H, Immunoblot analysis of brain lysates from APPswe mice, and from protected CCR2+/+GFPAPPswe and CCR2−/−GFPAPPswe BM chimeric mice for APP, α- and β-CTF, and Aβ. Aβ accumulation is enhanced in APPswe mice transplanted with CCR2-deficient BMCs, whereas APP processing is unchanged (n = 3–5 per group).
Figure 9.
Figure 9.
In vitro phagocytosis of Aβ1–42 is unchanged in the absence of CCR2. A, B, Phagocytosis of aged 5′-FAM Aβ1–42 by ex vivo isolated adult microglia (A) and bone marrow-derived macrophages (BMDM) (B) from CCR2−/− mice (black bars) and CCR2+/+ mice (white bars) as measured by flow cytometry 6 h after aged 5′-FAM amyloid β1–42 challenge. C, Addition of recombinant murine CCL2 (10 ng/ml) has no influence on Aβ phagocytosis in BMDM. Data are means ± SEM from 3 independent experiments with at least 3 mice per group.
Figure 10.
Figure 10.
Expression of immune and adhesion molecules on myeloid cells is independent of CCR2 or GFP expression. Flow cytometric comparison of immune surface markers on myeloid cell subsets, including adult microglia, blood Ly-6Chi monocytes, and macrophages derived from CCR2+/+, CCR2+/+GFP, CCR2−/−, and CCR2−/−GFP mice. All cells were gated on CD11b, and expression of CD11c, PSGL-1, integrin α4, and integrin β1 was assessed by FACS under baseline conditions. Isotype antibodies were used as negative controls.

References

    1. Ajami B, Bennett JL, Krieger C, Tetzlaff W, Rossi FM. Local self-renewal can sustain CNS microglia maintenance and function throughout adult life. Nat Neurosci. 2007;10:1538–1543. - PubMed
    1. Akiyama H, Barger S, Barnum S, Bradt B, Bauer J, Cole GM, Cooper NR, Eikelenboom P, Emmerling M, Fiebich BL, Finch CE, Frautschy S, Griffin WS, Hampel H, Hull M, Landreth G, Lue L, Mrak R, Mackenzie IR, McGeer PL, et al. Inflammation and Alzheimer's disease. Neurobiol Aging. 2000;21:383–421. - PMC - PubMed
    1. Algotsson A, Winblad B. The integrity of the blood–brain barrier in Alzheimer's disease. Acta Neurol Scand. 2007;115:403–408. - PubMed
    1. Alliot F, Godin I, Pessac B. Microglia derive from progenitors, originating from the yolk sac, and which proliferate in the brain. Brain Res Dev Brain Res. 1999;117:145–152. - PubMed
    1. Bard F, Cannon C, Barbour R, Burke RL, Games D, Grajeda H, Guido T, Hu K, Huang J, Johnson-Wood K, Khan K, Kholodenko D, Lee M, Lieberburg I, Motter R, Nguyen M, Soriano F, Vasquez N, Weiss K, Welch B, et al. Peripherally administered antibodies against amyloid beta-peptide enter the central nervous system and reduce pathology in a mouse model of Alzheimer disease. Nat Med. 2000;6:916–919. - PubMed

Publication types

MeSH terms