. 2011 Aug 3;31(31):11208-19.
doi: 10.1523/JNEUROSCI.0257-11.2011.

Lack of evidence for direct corticospinal contributions to control of the ipsilateral forelimb in monkey

Affiliations

Lack of evidence for direct corticospinal contributions to control of the ipsilateral forelimb in monkey

Demetris S Soteropoulos et al. J Neurosci. .

Abstract

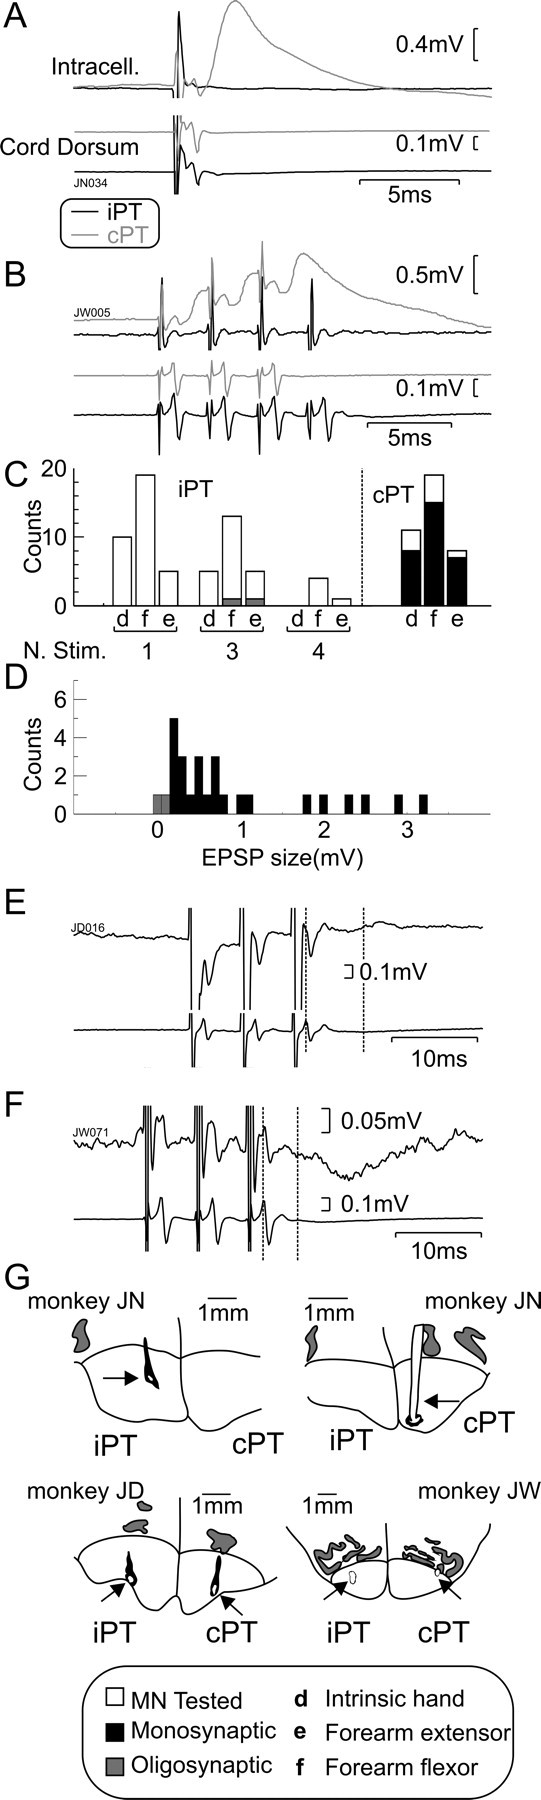
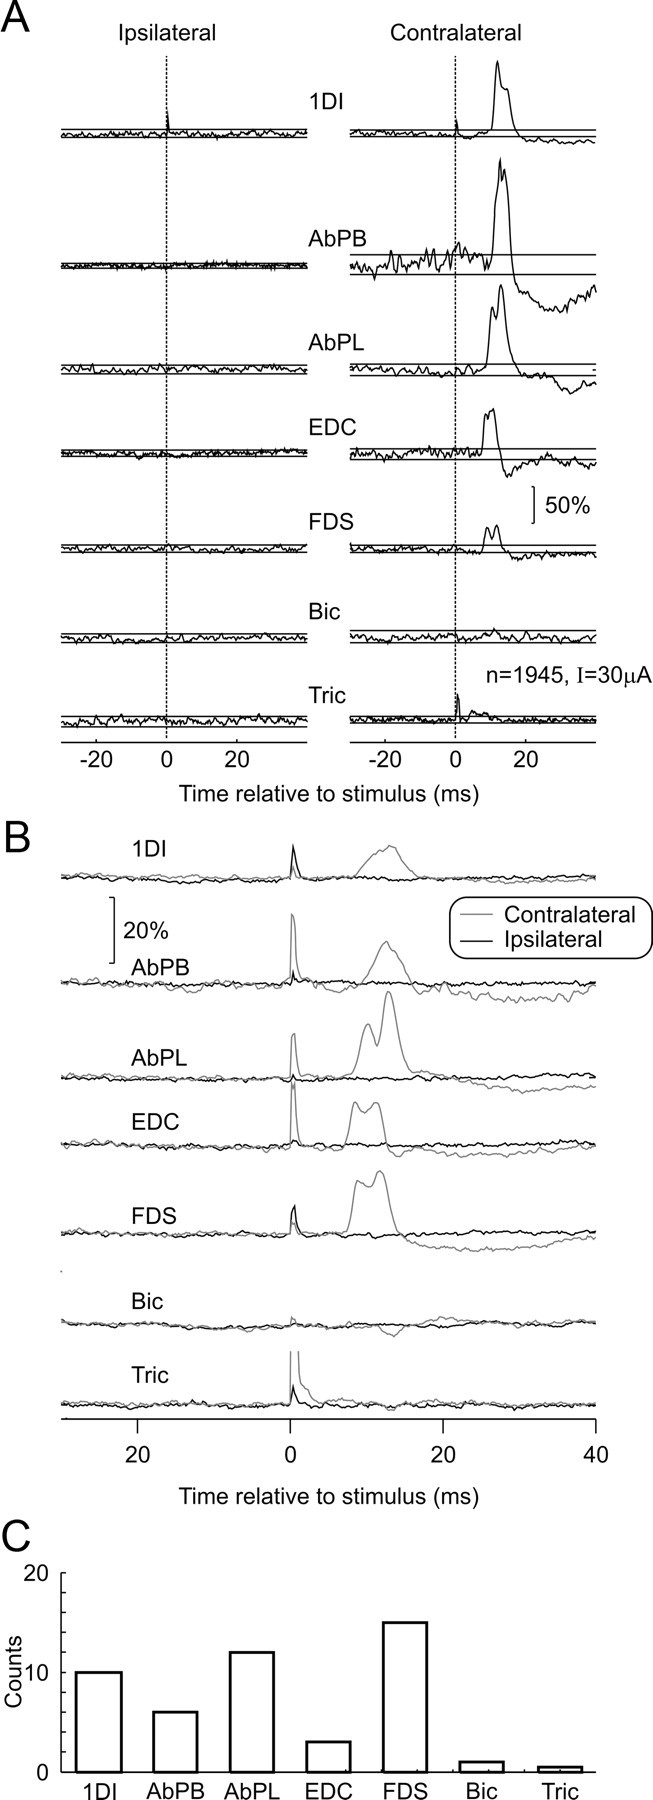
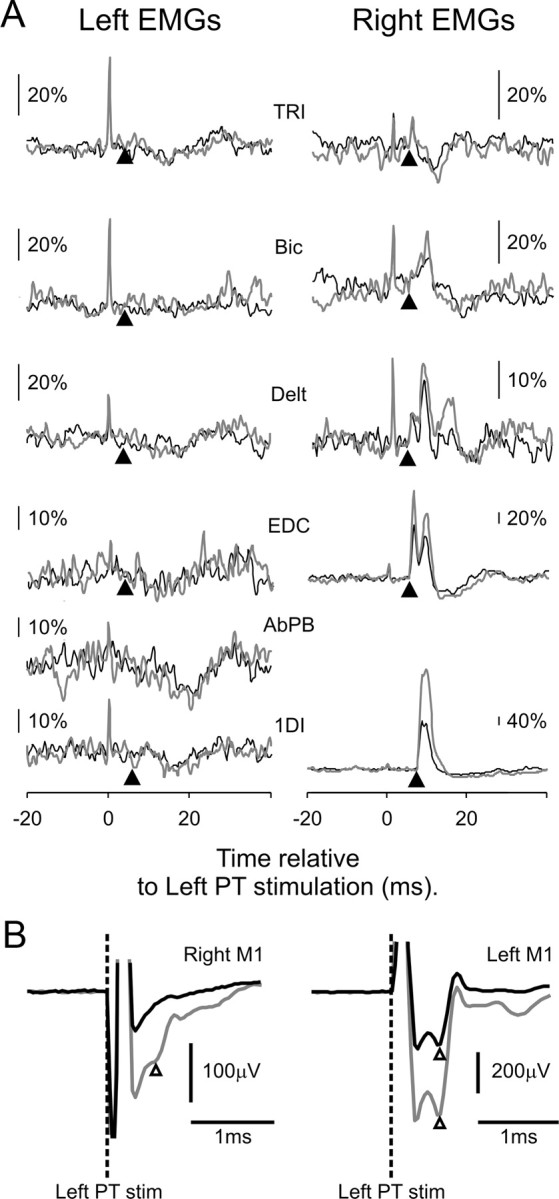
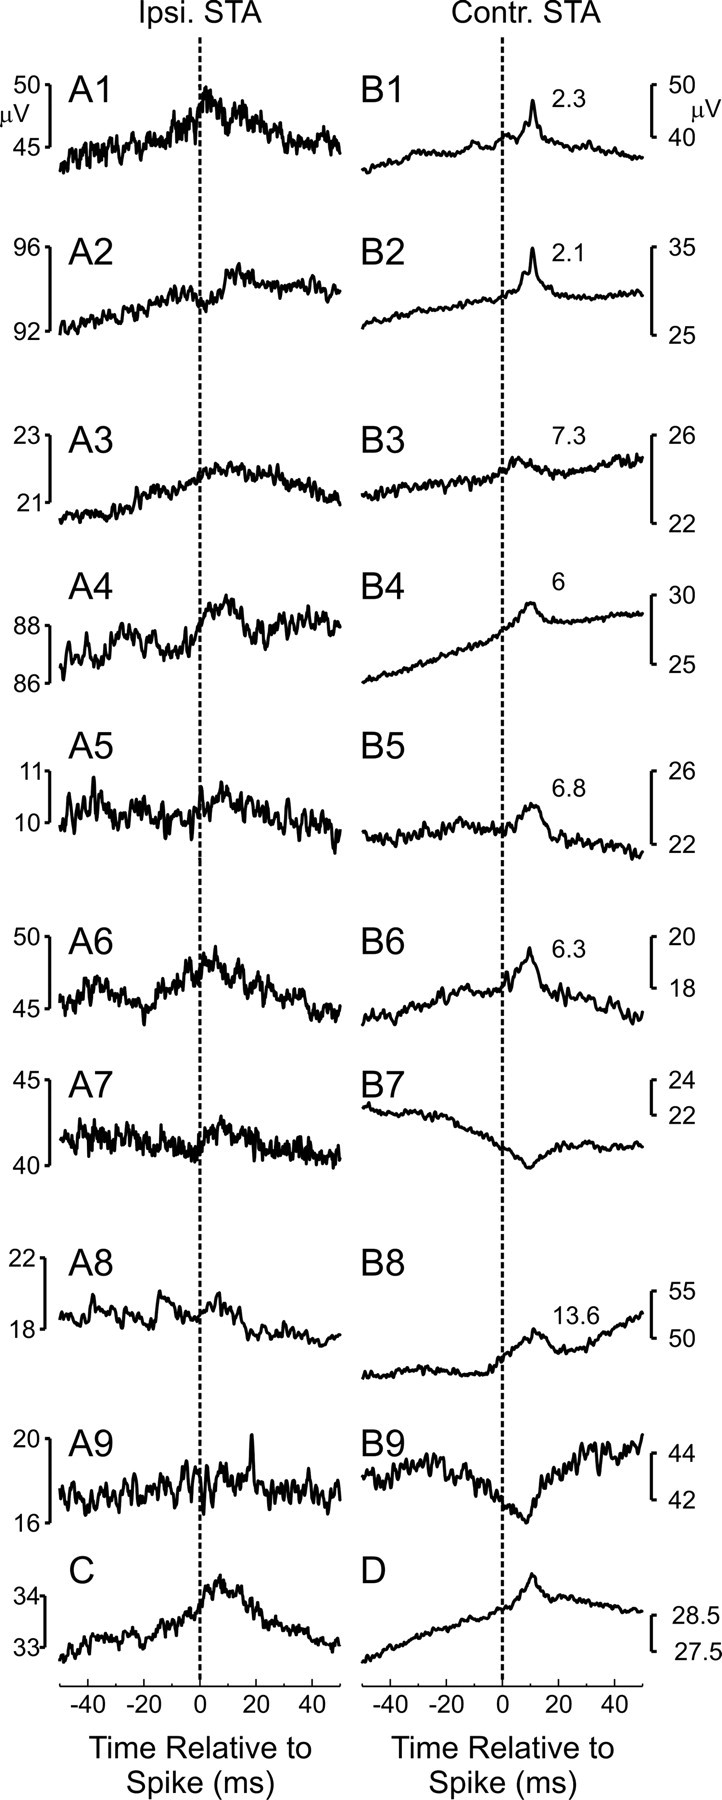
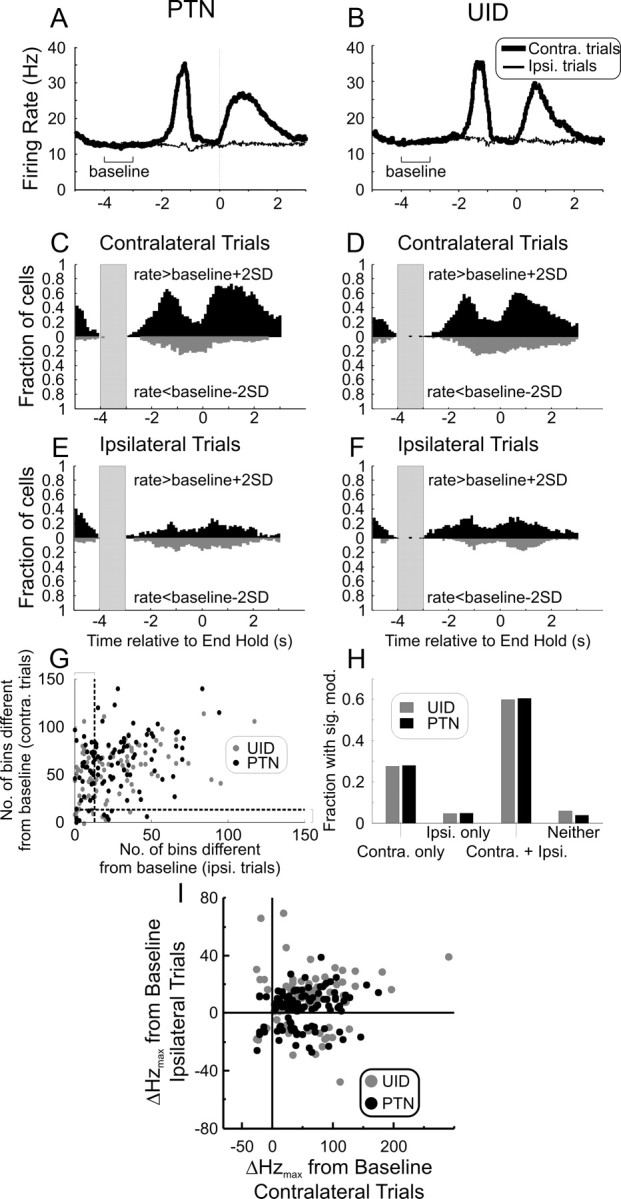
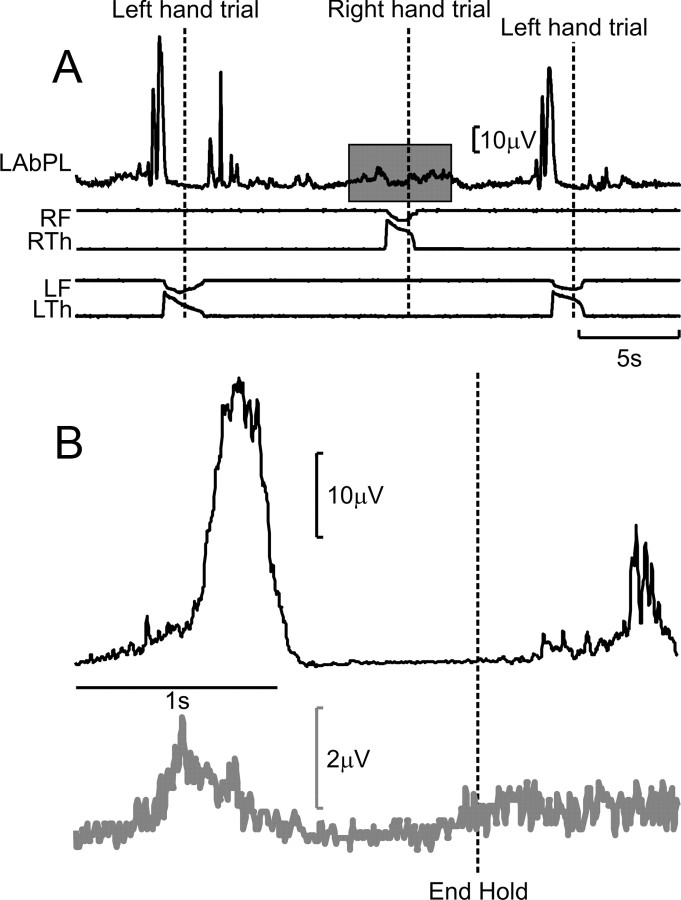
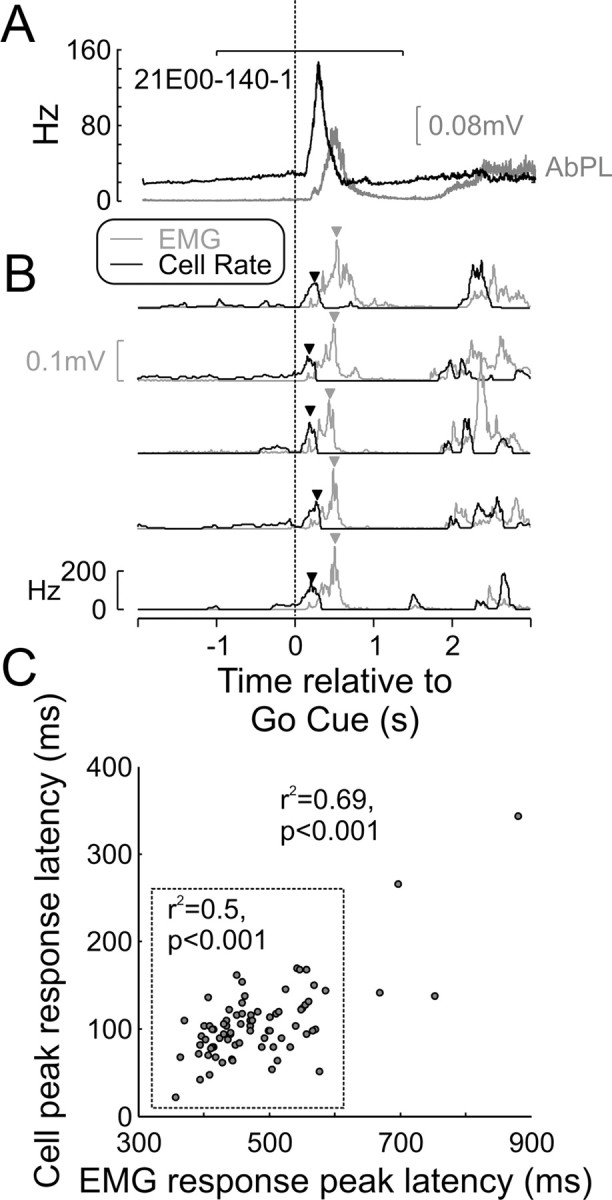
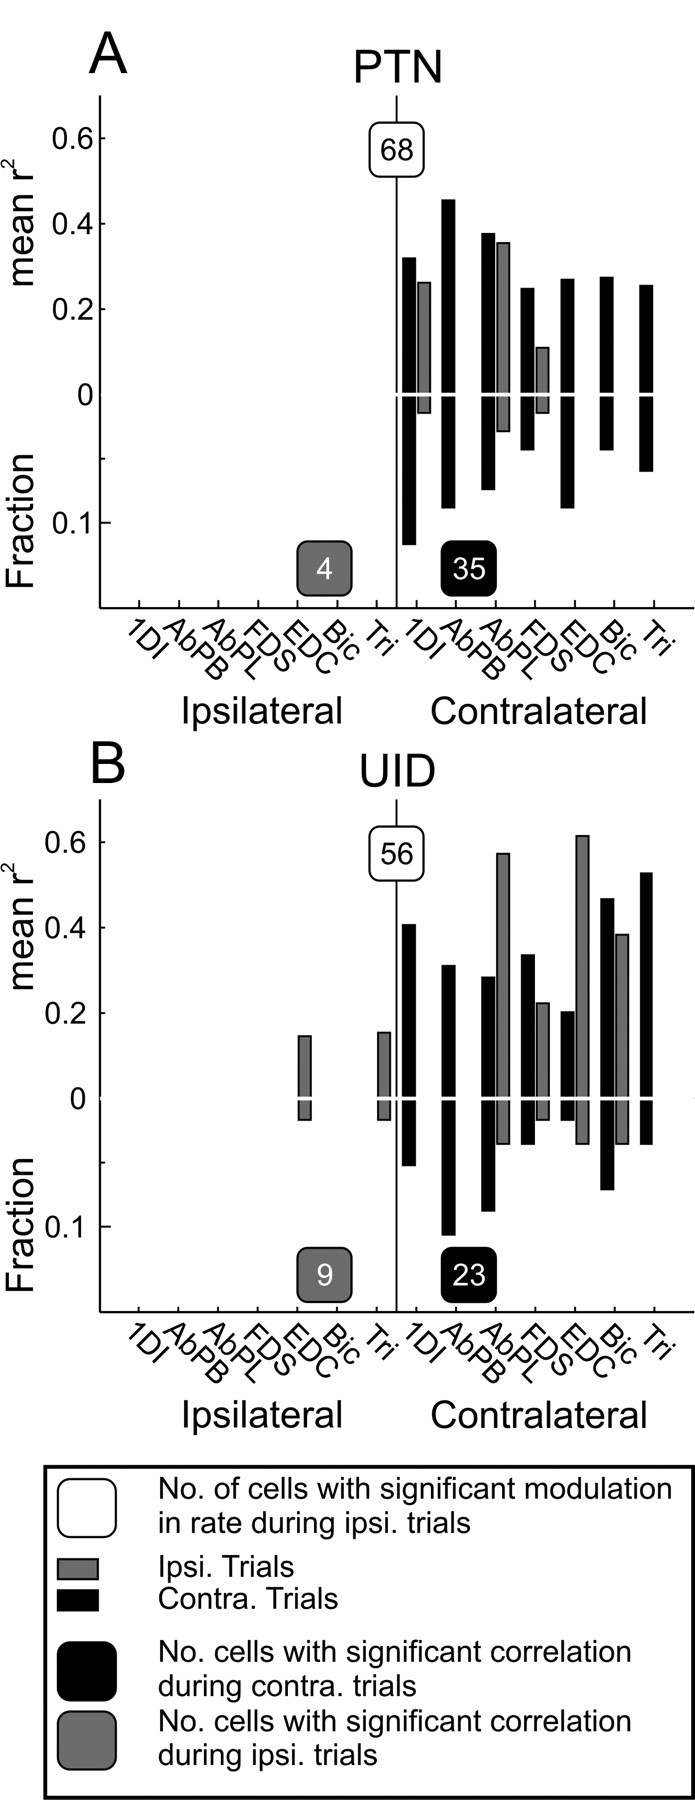
Strong experimental evidence implicates the corticospinal tract in voluntary control of the contralateral forelimb. Its potential role in controlling the ipsilateral forelimb is less well understood, although anatomical projections to ipsilateral spinal circuits are identified. We investigated inputs to motoneurons innervating hand and forearm muscles from the ipsilateral corticospinal tract using multiple methods. Intracellular recordings from 62 motoneurons in three anesthetized monkeys revealed no monosynaptic and only one weak oligosynaptic EPSP after stimulation of the ipsilateral corticospinal tract. Single stimulus intracortical microstimulation of the primary motor cortex (M1) in awake animals failed to produce any responses in ipsilateral muscles. Strong stimulation (>500 μA, single stimulus) of the majority of corticospinal axons at the medullary pyramids revealed only weak suppressions in ipsilateral muscles at longer latencies than the robust facilitations seen contralaterally. Spike-triggered averaging of ipsilateral muscle activity from M1 neural discharge (184 cells) did not reveal any postspike effects consistent with monosynaptic corticomotoneuronal connections. We also examined the activity of 191 M1 neurons during ipsilateral or contralateral "reach to precision grip" movements. Many cells (67%) modulated their activity during ipsilateral limb movement trials (compared with 90% with contralateral trials), but the timing of this activity was best correlated with weak muscle activity in the contralateral nonmoving arm. We conclude that, in normal adults, any inputs to forelimb motoneurons from the ipsilateral corticospinal tract are weak and indirect and that modulation of M1 cell firing seems to be related primarily to control of the contralateral limb.


Figures

Figure 1.
Figure 1.
Intracellular motoneuron responses to PT stimulation. A, Example averaged intracellular recordings (intracell.) from a forearm flexor motoneuron in which an EPSP is evoked by a single stimulus to cPT (n = 36) but not to iPT (n = 37). B, Averaged intracellular recordings from a different forearm flexor motoneuron showing EPSPs evoked by multiple stimuli to cPT (3 stimuli; n = 30) but not to iPT (4 stimuli; n = 55). C, Histogram showing the types of motoneurons tested with iPT/cPT and the maximum number of stimuli (N. Stim.) used. Bars to the right of the dotted line correspond to cPT (single stimulus). Gray bars, Oligosynaptic responses; black bars, monosynaptic responses; white bars, no responses. D, Distribution of postsynaptic response amplitudes from PT stimulation. Black bars, cPT effects; gray bars, iPT effects seen. E, Example of weak polysynaptic facilitatory response after a train of three stimuli to iPT. F, Example of weak polysynaptic inhibitory response to a train of three stimuli to iPT. G, Drawings showing the locations of tips of PT stimulating electrodes (arrows) reconstructed from histology. In A, B, E, and F, intracellular recordings are shown above cord dorsum records. In E and F, dotted vertical lines indicate the arrival of the PT volley to the cord and the measured onset of the response.
Figure 2.
Figure 2.
Responses to single-pulse intracortical microstimulation in M1. A, Average EMG responses evoked by sICMS delivered to a single site in M1 (intensity, 30 μA) while the monkey was performing the behavioral task. Traces are normalized as a percentage of the mean baseline level. B, Average across all 23 stimulation sites (black, ipsilateral muscles; gray, contralateral muscles). C, Frequency of effects in different contralateral muscles. Bic, Biceps; Tric, triceps.
Figure 3.
Figure 3.
Responses to single-pulse stimulation of the PT. A, Stimulus-triggered averages of bilateral rectified EMGs, using left PT stimulation at intensities of 500 μA (black) and 1000 μA (gray); n = 1511 and 919, respectively. The arrowheads under each trace indicate the onset latency of the response in that muscle after stimulation on the contralateral side. TRI, Triceps; Bic, biceps; Delt, deltoid. B, Antidromic field potentials (onsets marked by white arrowheads) recorded from M1 bilaterally following left PT stimulation (PT stim; indicated by dashed lines). Note that 500 μA stimuli evoked a response in left M1 only (black traces), whereas stimulation at 1000 μA (gray traces) also elicited a small response on the left side, indicating stimulus spread to the contralateral PT.
Figure 4.
Figure 4.
Spike-triggered averages of EMG from M1 cell activity. A1–A9, Nine example ipsilateral averages showing the clearest significant effects found. B1–B9, Same as A1–A9 but for contralateral muscles. C, Average across all significant ipsilateral effects. D, Average across all significant contralateral effects. Note that the averages are differently scaled. The numbers to the right of the contralateral effects correspond to the peak width at half-maximum.
Figure 5.
Figure 5.
Task-related activity of cells in M1 during ipsilateral (Ipsi.) and contralateral (Contra.) limb movements. A, Mean PSTH of 104 PTNs during ipsilateral (thin line) and contralateral (thick line) trials aligned to the End Hold task marker. B, Same as A but for 87 UIDs. C, Number of bins across the population of PTNs with rates higher than baseline plus 2 SD (upward, black bars) and with rates lower than baseline minus 2 SD (downward, gray bars) for contralateral trials. D, Same as C but for UIDs. E, Same as B but for ipsilateral trials. F, Same as D but for ipsilateral trials. The shaded area in C–F indicates the region used as baseline. Cell activity aligned to end of hold event (time 0). The time axis is the same for A–F. G, Cluster plot of the number of bins crossing the 2 SD limit for ipsilateral and contralateral trials. Each dot corresponds to a single neuron (gray, UIDs; black, PTNs). The vertical and horizontal dotted lines indicate the minimum number of bins needed before a cell can be judged to have significant modulation with the particular trial. H, Histogram of the number of cells showing modulation with the different trial lateralities. Simply by chance, we would expect a certain number of false positives in each category, and only the Contra. only and Contra. + Ipsi. categories have counts above the number expected by chance. I, Cluster plot of maximal rate modulation during ipsilateral (ordinate axis) and contralateral (abscissa) trials for PTNs and UIDs. The rate modulation is defined as the maximal absolute deviation relative to a baseline epoch. For both PTNs and UIDs during contralateral trials, the majority showed a rate increase; for ipsilateral trials, a higher proportion of cells showed a rate suppression.
Figure 6.
Figure 6.
Muscle mirroring. A, Excerpt from a single recording session showing the rectified activity of the left AbPL muscle during ipsilateral and contralateral trials. RF, Right finger lever displacement trace; RTh, right thumb lever displacement trace; LF, left finger lever displacement trace; LTh, left thumb lever displacement trace. Vertical dashed lines indicate the ends of the hold period. The shaded box marks modulation of left muscle activity during a right-handed trial. B, Activity of the left AbPL muscle averaged relative to the End Hold task marker, during ipsilateral (gray) and contralateral (black) trials. There is a weak modulation in activity during ipsilateral trials (note the difference in scale bars between the two trial types).
Figure 7.
Figure 7.
Latency correlation between M1 cell activity and EMG. A, Mean EMG activity of contralateral AbPL (gray line) and PSTH of M1 PTN (black line) aligned to the Go Cue. The horizontal bar at the top indicates the region used to search for the peak in cell and EMG response on a trial-by-trial basis. B, Five example trials showing the cell's instantaneous firing rate (black line) and EMG activity (gray line), with triangles indicating peak response times of both. C, Cluster plot showing good correlation between EMG peak response latency and neuronal peak response latency. When including all trials, the correlation coefficient was 0.69, and when extreme values (data points outside the dotted square) were excluded, this correlation was still highly significant at 0.5.
Figure 8.
Figure 8.
Population results for latency correlation analysis. For this analysis, only cells that showed a significant modulation with ipsilateral trials were considered. In cases in which the cell had a significant correlation with multiple muscles, the one with the strongest correlation was used for this plot. A, Mean peak correlation coefficients per muscle for PTNs showing a significant correlation with EMG. Black bars, Contralateral trials; gray bars, ipsilateral trials. Upward going bars show correlation coefficients, and downward going bars show the proportion of cells with the best correlation with that muscle. For both ipsilateral and contralateral trials, maximal correlations were with contralateral muscles. The numbers in the shaded boxes indicate how many cells showed a significant correlation with EMG during trials of the particular laterality. B, Same as A but for UIDs. Tri, Triceps; Bic, biceps.

References

    1. Aizawa H, Mushiake H, Inase M, Tanji J. An output zone of the monkey primary motor cortex specialized for bilateral hand movement. Exp Brain Res. 1990;82:219–221. - PubMed
    1. Armatas CA, Summers JJ, Bradshaw JL. Mirror movements in normal adult subjects. J Clin Exp Neuropsychol. 1994;16:405–413. - PubMed
    1. Baker SN, Lemon RN. A computer simulation study of the production of post-spike facilitation in spike triggered averages of rectified EMG. J Neurophysiol. 1998;80:1391–1406. - PubMed
    1. Baker SN, Lemon RN. Precise spatiotemporal repeating patterns in monkey primary and supplementary motor areas occur at chance levels. J Neurophysiol. 2000;84:1770–1780. - PubMed
    1. Baker SN, Olivier E, Lemon RN. An investigation of the intrinsic circuitry of the motor cortex of the monkey using intra-cortical microstimulation. Exp Brain Res. 1998;123:397–411. - PubMed

Publication types

LinkOut - more resources