. 2011 Aug 3;31(31):11351-61.
doi: 10.1523/JNEUROSCI.6689-10.2011.

The detection of visual contrast in the behaving mouse

Affiliations

The detection of visual contrast in the behaving mouse

Laura Busse et al. J Neurosci. .

Abstract

The mouse is becoming a key species for research on the neural circuits of the early visual system. To relate such circuits to perception, one must measure visually guided behavior and ask how it depends on fundamental stimulus attributes such as visual contrast. Using operant conditioning, we trained mice to detect visual contrast in a two-alternative forced-choice task. After 3-4 weeks of training, mice performed hundreds of trials in each session. Numerous sessions yielded high-quality psychometric curves from which we inferred measures of contrast sensitivity. In multiple sessions, however, choices were influenced not only by contrast, but also by estimates of reward value and by irrelevant factors such as recent failures and rewards. This behavior was captured by a generalized linear model involving not only the visual responses to the current stimulus but also a bias term and history terms depending on the outcome of the previous trial. We compared the behavioral performance of the mice to predictions of a simple decoder applied to neural responses measured in primary visual cortex of awake mice during passive viewing. The decoder performed better than the animal, suggesting that mice might not use optimally the information contained in the activity of visual cortex.


Figures

Figure 1.
Figure 1.
Apparatus and training. A, Scheme of the behavioral choice box. B, Picture showing the mouse triggering stimulus presentation by placing the snout in the central port. C, Mice learn the visual contrast detection within 3–4 weeks of training. Mice were trained for 1 week in stage 2 and 3 weeks in stage 3. Dashed lines indicate chance performance. On days 1–5, chance is 33% for a naive mouse, 50% for a mouse that understands the basic task. N = 3. D, Heavier mice performed more trials per session. Each data point represents a single animal (N = 12). Relation between average number of trials per session and average body weight (r = 0.78, p < 0.01). Open and filled circles indicate females (N = 10) and males (N = 2), respectively. Line is given by linear regression.
Figure 2.
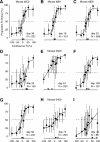
Figure 2.
Psychometric functions for contrast detection in mice. Each panel represents data acquired in a single 15–40 min session. Proportion of right port (R) choices is plotted as a function of signed stimulus contrast, with negative contrasts representing stimuli shown on the left. N, Number of trials per session. Filled triangles indicate bias—the contrast at which the animal went 50% of the times to the left and 50% of the times to the right. The difference in contrast between the filled triangles and the open triangles indicates contrast threshold. Error bars are binomial confidence intervals. A–C, Three sessions with low bias, yielding precise estimates of contrast threshold. Sessions 100331, 100310, 100326. D–F, Three sessions for a single mouse at different days of testing, showing a strong bias for L choices (34.5%, D), a strong bias for R choices (−57.7%, E) and a negligible bias (1.3%, F). Sessions 090910, 091016, 091203. G–I, Three sessions for a single mouse at different days, showing decreasing degrees of reliability of the estimated threshold, with confidence intervals 6.7–23.1% in G, 4.7–80.3% in H, and 8.0–69.7% in I. Sessions 091204, 100427, and 090914.
Figure 3.
Figure 3.
Small imbalances in fluid reward cause large biases that change gradually with time and are shared across animals. Each data point represents the average bias across all training sessions within a week. Different symbols represent data from three different animals. Asterisks indicate bias for the sessions in Figure 2, D–F. The animals favored the left port in the first few weeks and the right port in the subsequent weeks, most likely because of tiny imbalances in fluid reward, in the order of 1 μl.
Figure 4.
Figure 4.
The distribution of contrast thresholds estimated across days in a single mouse is consistent with a single estimate of ∼20%. A, Contrast thresholds for individual sessions, sorted in increasing order. Symbols indicate estimated threshold and lines indicate 95% confidence intervals obtained by bootstrapping. Open symbols indicate sessions in which bias exceeded ±30% contrast. Letters G–I indicate sessions used as examples in Figure 2, G–I, respectively. B, Corresponding biases. C, Number of trials. D, Likelihood of the distribution of contrast thresholds. The maximum corresponds to the single estimate that is consistent with all the observations and is located at 19% contrast (arrow).
Figure 5.
Figure 5.
Schematic illustration of the probabilistic choice model. The animal's choice is modeled as a weighted sum of a sensory term (depending on contrast), two strategy terms (weighing past-trial success and failure), and a bias term. Predictors for an example trial are indicated by the dashed boxes, fitted weights are given by v(c) (contrast), bs (success), bf (failure), and b0 (bias). The resulting variable z is passed through a logistic function that yields a probability for right-port choices (p). Trial-by-trial choices are simulated by randomly drawing from a Bernoulli distribution with parameter p. This step corresponds to flipping a coin, with p being the fairness of the coin.
Figure 6.
Figure 6.
The probabilistic choice model fitted to data. A, Parameters fitted by logistic regression to data from one session (Mouse 0409, session 090813). They determine the sensory term v(c), the bias b0, and the strategy weights bs and bf for success and failure. The solid line is the fit of a hyperbolic ratio function. B, The model predicts the corresponding psychometric data. Shaded area indicates the 95% confidence interval of responses simulated by the fitted model. C, The model predicts the history-dependence of behavior. Gray level indicates the tendency to choose L or R in the present trial given the possible outcomes of the previous trial: success on the L, success on the R, failure on the L, failure on the R. Columns show the mouse behavior (left), the prediction of the probabilistic model (middle), and the prediction of the model with strategy weights set to zero (right). In this example, strategy weights are low, and both models perform equally well. D–F, Another example session (animal tdD4, session 100630). The model predicts both the leftwards bias and a strong negative weight for past success. Only the full model can capture the tendency to switch after a success. G–I, A third example (animal tdB1, session 100212). Again, the full model is needed to capture the history effects.
Figure 7.
Figure 7.
The probabilistic choice model makes accurate predictions of behavior when strategy terms are included. A, Model quality index for the full model, including weights for past successes and failures. The model quality index ranges from −1 (bad predictions) to +1 (perfect predictions). B, Model quality index for the model with only the sensory term and overall bias. C, Distribution of strategies across animals and sessions. Black points correspond to sessions in which at least one of the weights is significantly different from zero.
Figure 8.
Figure 8.
Comparison of key parameters of the psychometric analysis and the probabilistic choice model. A, Comparison of bias. The parameter b0 of the choice model is plotted as a function of the parameter μ of the psychometric function for all sessions and animals. Note that a positive bias in the psychometric analysis denotes a preference for the left port, which corresponds to a negative bias in the choice model. The solid line is given by robust regression (offset = 0.006, p = 0.5; slope = −0.02, p < 0.001). B, Comparison of contrast threshold. The contrast threshold as given by the choice model is plotted for all sessions as a function of parameter σ of the psychometric function. The solid line is given by robust regression (offset = 14.36, p < 0.001; slope = 0.34, p < 0.001). C, For each animal, the median threshold across sessions as obtained by the choice model is plotted as a function of the overall threshold given by the maximum likelihood analysis (offset = 6.0, p = 0.24; slope = 0.78, p < 0.01).
Figure 9.
Figure 9.
Contrast response functions in visual cortex of awake mice and comparison with inferred internal representation of contrast as revealed by the probabilistic model. A, Representative example of a contrast response function measured at a single recording site. The solid line is a fit by the hyperbolic ratio function. Triangle indicates semisaturation contrast. B, Contrast responses of all sites in the sample (N = 85). Black line corresponds to the example in A. C, The relationship of semisaturation contrast and exponent across the population of recorded sites. Circle corresponds to the example in A. Triangles indicate the semisaturation contrasts for the median responses across the neuronal population (black triangle, c50 = 34%) and for the 10% most sensitive and least sensitive contrast responses (gray triangles, c50 <11% and >50%). D, The relationship of semisaturation contrast and exponent for the inferred internal representation of contrast by the probabilistic model across all animals and sessions.
Figure 10.
Figure 10.
Comparison of performance of a simple decoding model applied to V1 contrast responses with the best behavioral performance of the animals in the behavioral study. A, Neurometric curves predicting the proportion of rightward choices as a function of stimulus contrast. The fill color of the data points (white to black) indicates the size of the population available to the decoder (10–85 sites). Lines correspond to fitted psychometric functions (Eq. 1). B, Contrast threshold as a function of the size of the neuronal pool. For comparison, small horizontal lines at the left side indicate examples for the best contrast thresholds for each animal in the behavioral study. The arrow points at the mean of those measurements.

References

    1. Albrecht DG, Hamilton DB. Striate cortex of monkey and cat: contrast response function. J Neurophysiol. 1982;48:217–237. - PubMed
    1. Andermann ML, Kerlin AM, Reid RC. Chronic cellular imaging of mouse visual cortex during operant behavior and passive viewing. Front Cell Neurosci. 2010;4:3. - PMC - PubMed
    1. Averbeck BB, Latham PE, Pouget A. Neural correlations, population coding and computation. Nat Rev Neurosci. 2006;7:358–366. - PubMed
    1. Bock DD, Lee WC, Kerlin AM, Andermann ML, Hood G, Wetzel AW, Yurgenson S, Soucy ER, Kim HS, Reid RC. Network anatomy and in vivo physiology of visual cortical neurons. Nature. 2011;471:177–182. - PMC - PubMed
    1. Brainard DH. The Psychophysics Toolbox. Spatial Vision. 1997;10:433–436. - PubMed

Publication types

LinkOut - more resources