. 2011 Aug 3;31(31):11411-20.
doi: 10.1523/JNEUROSCI.0345-11.2011.

Neuroaxonal dystrophy in calcium-independent phospholipase A2β deficiency results from insufficient remodeling and degeneration of mitochondrial and presynaptic membranes

Affiliations

Neuroaxonal dystrophy in calcium-independent phospholipase A2β deficiency results from insufficient remodeling and degeneration of mitochondrial and presynaptic membranes

Goichi Beck et al. J Neurosci. .

Abstract

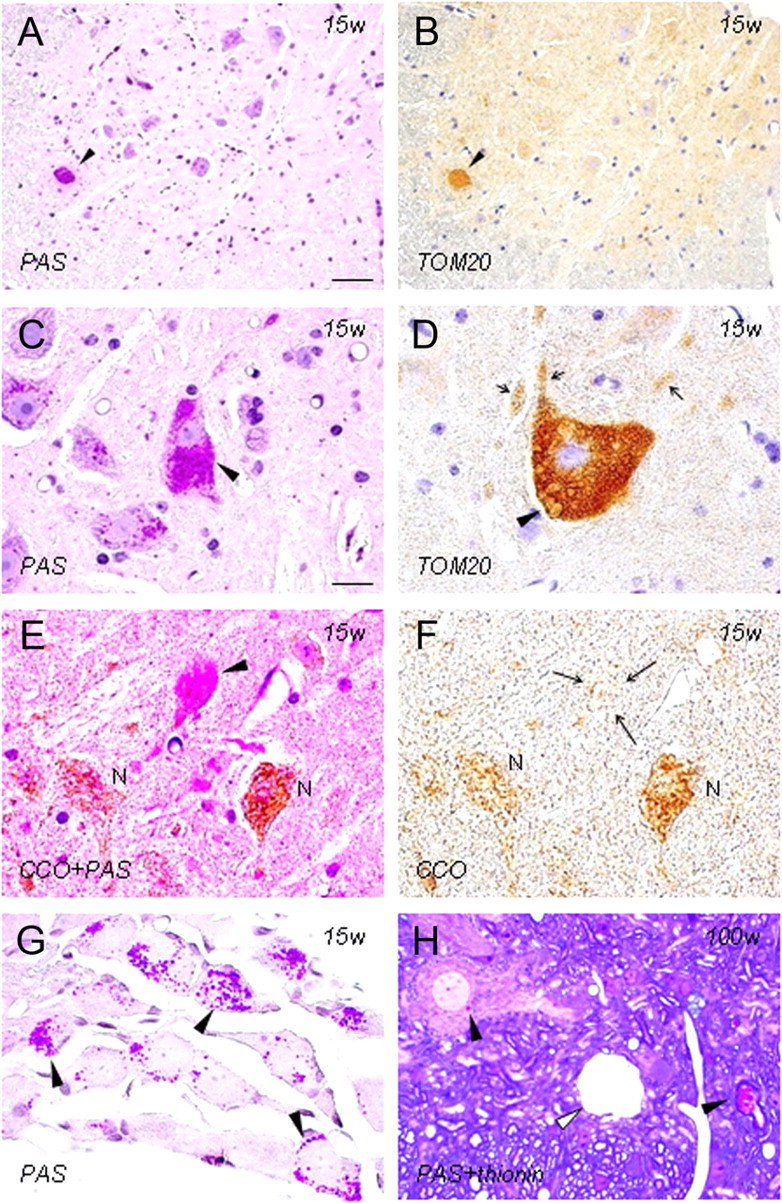
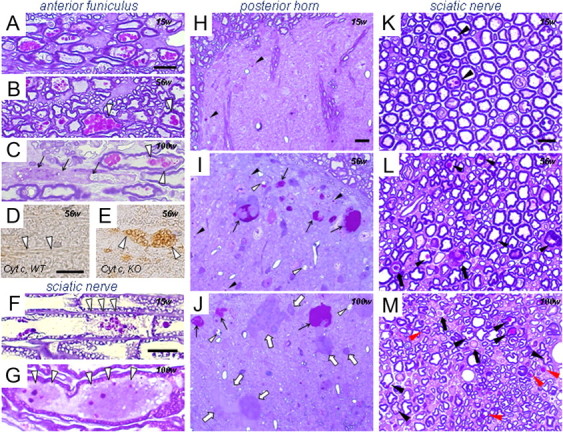
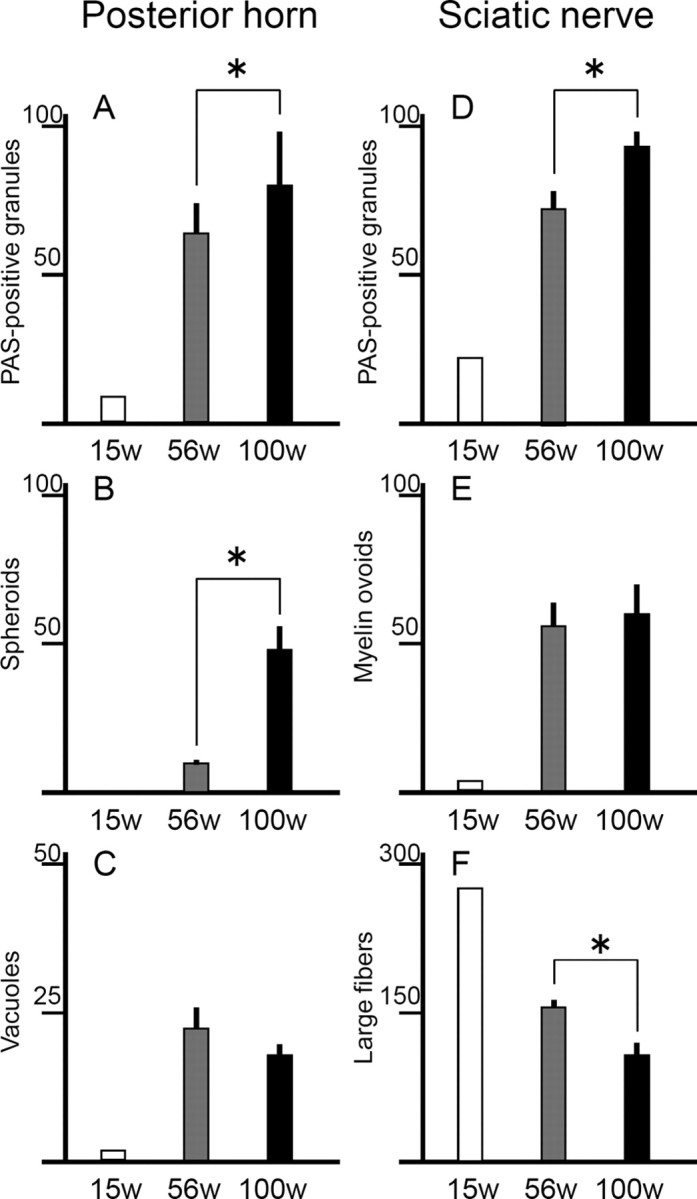
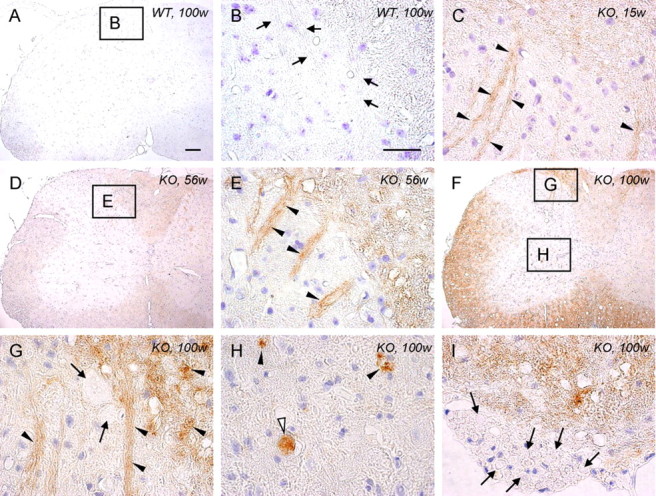
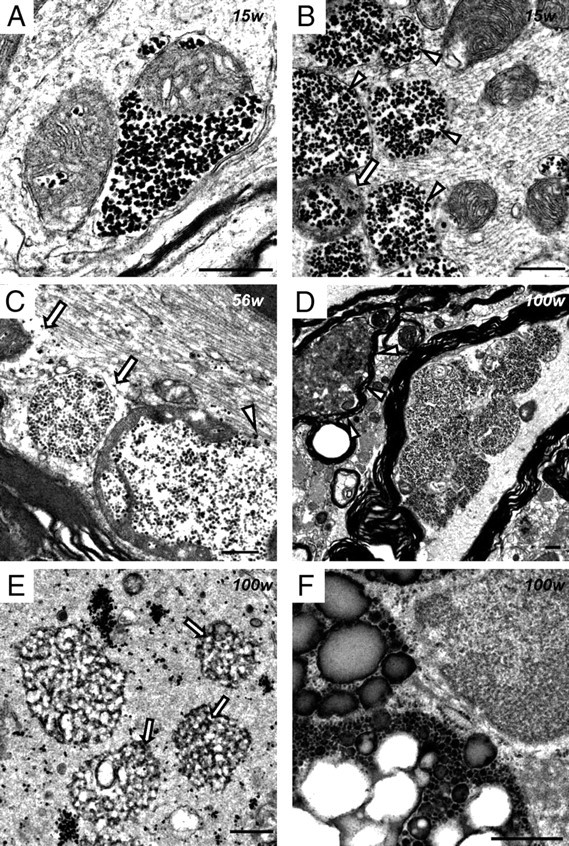
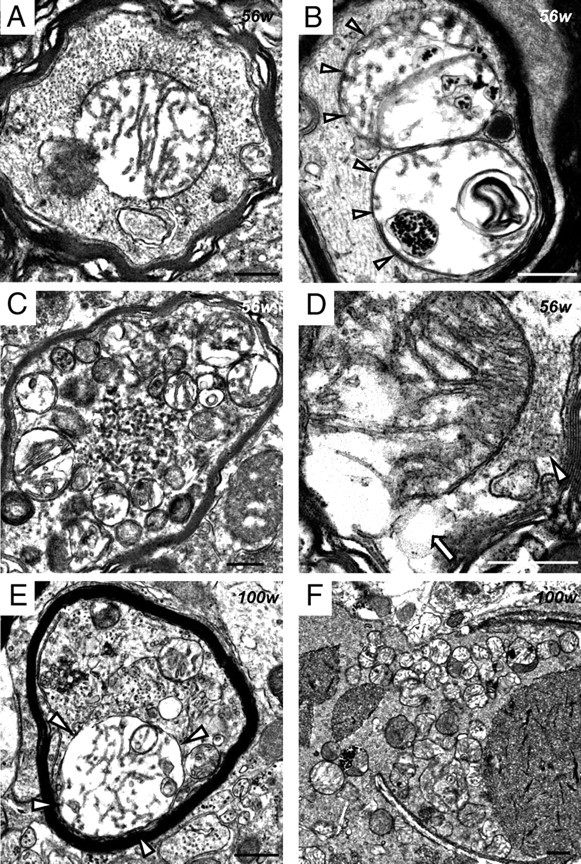
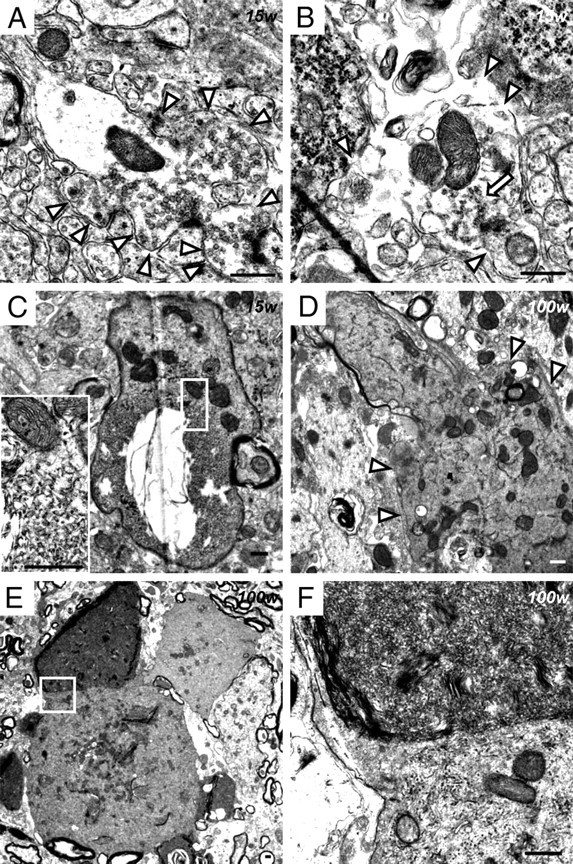
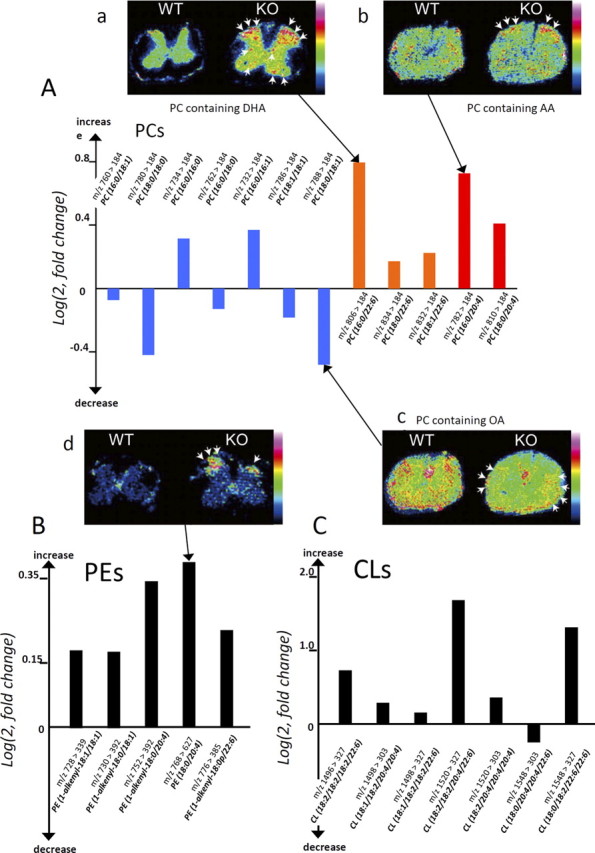
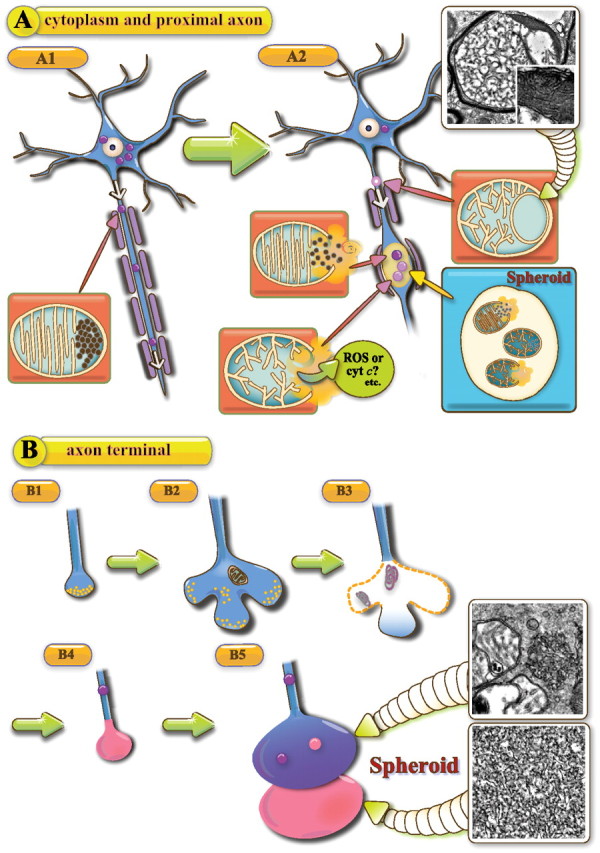
Infantile neuroaxonal dystrophy (INAD) is a fatal neurodegenerative disease characterized by the widespread presence of axonal swellings (spheroids) in the CNS and PNS and is caused by gene abnormality in PLA2G6 [calcium-independent phospholipase A(2)β (iPLA(2)β)], which is essential for remodeling of membrane phospholipids. To clarify the pathomechanism of INAD, we pathologically analyzed the spinal cords and sciatic nerves of iPLA(2)β knock-out (KO) mice, a model of INAD. At 15 weeks (preclinical stage), periodic acid-Schiff (PAS)-positive granules were frequently observed in proximal axons and the perinuclear space of large neurons, and these were strongly positive for a marker of the mitochondrial outer membrane and negative for a marker of the inner membrane. By 100 weeks (late clinical stage), PAS-positive granules and spheroids had increased significantly in the distal parts of axons, and ultrastructural examination revealed that these granules were, in fact, mitochondria with degenerative inner membranes. Collapse of mitochondria in axons was accompanied by focal disappearance of the cytoskeleton. Partial membrane loss at axon terminals was also evident, accompanied by degenerative membranes in the same areas. Imaging mass spectrometry showed a prominent increase of docosahexaenoic acid-containing phosphatidylcholine in the gray matter, suggesting insufficient membrane remodeling in the presence of iPLA(2)β deficiency. Prominent axonal degeneration in neuroaxonal dystrophy might be explained by the collapse of abnormal mitochondria after axonal transportation. Insufficient remodeling and degeneration of mitochondrial inner membranes and presynaptic membranes appear to be the cause of the neuroaxonal dystrophy in iPLA(2)β-KO mice.


Figures

Figure 1.
Figure 1.
Immunohistochemistry of PAS-positive granules as components of mitochondrial membranes in iPLA2β-KO mice. A–G, 15 weeks; H, 100 weeks; A–F, H, anterior horn; G, dorsal root ganglia; A, C, G, PAS staining; B, D, immunohistochemistry for TOM20; E, double staining with PAS and immunohistochemistry for CCO; F, immunohistochemistry for CCO; H, double staining with PAS and thionin. A and B are serial sections, and E and F are the same section. A, B, A strongly PAS-positive anterior horn cell (arrowhead in A) shows strong positivity for TOM20 (arrowhead in B). C, An anterior horn cell (arrowhead) is filled with PAS-positive granules. Apparently normal anterior horn cells also contain some PAS-positive granules. D, There are many vesicles whose rims are positive for TOM20 (arrowhead) in the anterior horn cell and in neurites (arrows). E, F, An anterior horn cell (arrowhead in E) filled with PAS-positive granules is almost negative for CCO (arrows in F). The cytoplasm of other anterior horn cells (N), which contain a few PAS-positive granules, is stained for CCO. G, There are many PAS-positive granules in the cytoplasm of dorsal root ganglion cells (arrowheads). H, PAS-positive granules are evident in the perinuclear space of anterior horn cells and myelinated axons (arrowheads). A large vacuole (white arrowhead) is present in the neuropil. Scale bars: (in A) A, B, 40 μm; (in C) C–H, 20 μm.
Figure 2.
Figure 2.
PAS-positive granules in proximal and distal parts of axons in iPLA2β-KO mice. A, F, H, K, 15 weeks; B, D, E, I, L, 56 weeks; C, G, J, M, 100 weeks. A–E, Anterior funiculus; F, G, K–M, sciatic nerve; H–J, posterior horn. Semithin Epon sections stained with PAS and thionin (A–C, F–M) and frozen sections immunostained for cyt c (D, E). A, Strongly PAS-positive granules are evident in proximal axons. B, Large PAS-positive granules are frequently present in swollen axons (white arrowheads). C, Degeneration of a proximal axon (arrows), with PAS-positive granules still evident in remaining axons. Some of these granules are irregular in shape and color (white arrowheads). D, E, Many vesicles strongly immunopositive for cyt c (white arrowheads) are evident in the proximal axons in iPLA2β-KO mice (E) but are not observed in WT mice (white arrowheads in D). F, Focal axonal degeneration (white arrowheads) around vacuolated or irregular PAS-positive granules. G, Two spheroids (white arrowheads) containing PAS-positive granules. H, Only a few PAS-positive granules (arrowheads) are evident. I, Large numbers of PAS-positive granules (arrowheads) and PAS-positive spheroids (arrows). Small vacuoles (white arrowheads) are also evident. J, PAS-negative spheroids (white arrows) are frequent, in addition to PAS-positive spheroids (arrows). Vacuoles (white arrowheads) are larger than those at 56 weeks in I. K, A few large fibers contain PAS-positive granules (arrowheads) in the axon. L, The number of large fibers is apparently reduced, and myelin ovoids (arrows) and dark axons are frequently evident. PAS-positive granules (arrowheads) are increased in number compared with the situation at 15 weeks (K). M, Reduction of large fibers is severe. Myelin ovoids are present (arrows). PAS-positive granules of various sizes are evident in both large (black arrowheads) and small (red arrowheads) fibers. Scale bars: (in A) A–C, 10 μm; (in D) D, E, 10 μm; (in F) F, G, 10 μm; (in H) H–J, 10 μm; (in K) K–M, 10 μm.
Figure 3.
Figure 3.
Progressive increase of PAS-positive granules and axonal degeneration in distal parts of axons in iPLA2β-KO mice. A–C, Posterior horns; D–F, sciatic nerves. For iPLA2β-KO mice, white bars represent data at 15 weeks (n = 2, mean), gray bars data at 56 weeks (n = 4, mean ± SD), and black bars data at 100 weeks (n = 5, mean ± SD). *p < 0.05, Wilcoxon's rank-sum test. A, D, In both posterior horns and sciatic nerves, PAS-positive granules are significantly more frequent at 100 weeks than at 56 weeks (p < 0.05, Wilcoxon's rank-sum test). B, In the posterior horns, spheroids are significantly more frequent at 100 weeks than at 56 weeks (p < 0.05, Wilcoxon's rank-sum test). C, The number of vacuoles (>5 μm) in the posterior horn of iPLA2β-KO mice does not differ significantly between 56 and 100 weeks. E, The number of myelin ovoids in sciatic nerves of iPLA2β-KO mice does not differ significantly between 56 and 100 weeks. F, Large fibers in sciatic nerves are significantly fewer at 100 weeks than at 56 weeks (p < 0.05, Wilcoxon's rank-sum test).
Figure 4.
Figure 4.
High expression of 4-HNE in the spinal cord of iPLA2β-KO mice. A, B, WT mice at 100 weeks; C, KO mice at 15 weeks; D, E, KO mice at 56 weeks; F–I, KO mice at 100 weeks. A, B, No staining is evident in the control. B is a high-magnification view of the square in A. Axons in the posterior horn are negative for 4-HNE (arrows). C, Some of the axons are immunopositive for 4-HNE (arrowheads). D, E, The white matter and the axons in the posterior horn (arrowheads in E) are more strongly immunopositive for 4-HNE than at 15 weeks (C). E is a high-magnification view of the square in D. F–H, The white matter is more strongly immunopositive for 4-HNE than at 56 weeks (D, E). G and H are high-magnification views of the top and bottom squares in F, respectively. The axons are strongly immunopositive for 4-HNE (arrowheads in G), but large spheroids in the posterior horn are negative (arrows in G). The vacuoles (arrowheads in H) and the spheroid (white arrowhead in H) are strongly positive for 4-HNE. I, Axons in the anterior root are negative for 4-HNE (arrows). Scale bars: (in A) A, D, F, 100 μm; (in B), C, E, G–I, 10 μm.
Figure 5.
Figure 5.
Electron microscopic observation of abnormal mitochondria with dense granules in iPLA2β-KO mice. A, B, 15 weeks; C, 56 weeks; D–F, 100 weeks; A–D, anterior horn; E, F, posterior horn. A, A proportion of the mitochondrial cristae are diminished, and dense granules occupy the resulting space. The outer membrane is morphologically preserved. B, An abnormal mitochondrion containing dense granules (arrow) and abnormal mitochondrion-like structures (arrowheads) with a single membrane enclosing many dense granules. Neurofilaments are mostly preserved. C, Dense granules are released from abnormal mitochondria with broken membranes (white arrowhead). Focal loss of the axonal cytoskeleton is evident around abnormal mitochondria with degenerated cristae (white arrows). D, Several abnormal mitochondrion-like structures have accumulated on one side of the axon. A highly degenerated axon is also evident (white arrowheads). E, Dense granules are gathered or scattered in spheroids. Small and round tubulovesicular structures contain dense granules (arrows). F, Spheroid containing three abnormal aggregates consisting of various-sized dense granules. The smallest one resembles an abnormal mitochondrion-like structure (B–D) but has no membrane around it. Scale bars, 500 nm.
Figure 6.
Figure 6.
Abnormal mitochondria with tubular and branching cristae and tubulovesicular structures in iPLA2β-KO mice. A–D, 56 weeks; E, F, 100 weeks. A–F, Anterior horn. A, A myelinated fiber contains abnormal mitochondria, whose cristae are diffusely degenerated, tubular, and branching. Neurofilaments are mostly preserved. B, Dense granules, degenerative membranes, and tubular and branching cristae are evident in the severely degenerated mitochondria (white arrowheads). C, A swollen axon is filled with round tubulovesicular structures and similar-sized abnormal mitochondria. D, There is focal loss (white arrow) of the axonal cytoskeleton (white arrowhead) near the broken membrane of an abnormal mitochondrion. E, A myelinated axon is entirely filled with tubulovesicular structures. Abnormal mitochondria with tubular and branching cristae are also evident (white arrowheads). F, Many abnormal mitochondria and various-sized round tubulovesicular structures are evident in a large spheroid. Scale bars, 500 nm.
Figure 7.
Figure 7.
Electron microscopic observation of presynaptic membranes and tubulovesicular structures at the axon terminals of iPLA2β-KO mice. A–C, 15 weeks; D–F, 100 weeks. A–F, Posterior horn. A, An abnormally expanded and loose presynaptic membrane (white arrowheads). Synaptic vesicles, apparently normal mitochondria, and postsynaptic densities are evident. B, Most of the presynaptic membranes have disappeared (white arrowheads). Degenerative membranous or vesicular structures (white arrow) and apparently normal mitochondria are evident. C, The tubulovesicular structures are followed by a degenerative axon containing dark mitochondria in a myelinated small fiber. The inset is a high-magnification view of the white square, which shows tubulovesicular structures and mitochondria containing dense granules. D, A large and irregular spheroid (white arrowheads), containing tubulovesicular structures, degenerative membranes, and mitochondria, has formed at the axon terminal of a degenerated small fiber. E, A large spheroid contains tubulovesicular structures of various densities. F, High-magnification view of the white square in E. Two types of tubulovesicular structures are attached to each other. The top one shows a high density of tubulovesicular structures, whereas the bottom one has a low density of tubulovesicular structures and contains mitochondria. Scale bars, 500 nm.
Figure 8.
Figure 8.
Quantitative lipid profiling of spinal cords from iPLA2β-KO mice and wild-type mice. In the graphs (A–C), relative abundances of PCs (A), PEs (B), and CLs (C) in iPLA2β-KO mice at 56 weeks, which were quantified by liquid chromatography/electrospray ionization tandem mass spectrometry in multiple reaction monitoring mode, are shown by bars, respectively. The vertical axis represents the logarithmic value of the detected intensity ratio (KO/WT), i.e., log(2, Intensity KO/Intensity WT). The bar with a positive value indicates an increase in the KO, whereas one with a negative value indicates a reduction. Blue bars represent PC species containing saturated or monounsaturated fatty acids, orange bars those containing DHA, and red bars those containing AA. In the figures (a–d), the distributions of lipid species that showed notable differences between KO mice and WT mice at 102 weeks are demonstrated by matrix-assisted laser desorption/ionization-imaging mass spectrometry. A-a, Among PC species, one containing DHA is prominently increased in the gray matter of a KO mouse, especially in the posterior horn (arrows), compared with a WT mouse. A-b, A PC species containing AA is accumulated in the posterior horn of a KO mouse (arrows). A-c, A myelin constituting PC species, one containing OA, is decreased in the white matter region of a KO mouse (arrows). B, All five analyzed PE species were increased in the KO spinal cord, and the most accumulated species was prominently found in the posterior horn of a KO mouse (arrows in d). C, Six of the seven CL molecular species analyzed were increased.
Figure 9.
Figure 9.
Schematic representation of the hypothetical pathomechanism of neuroaxonal dystrophy in iPLA2β-KO mice. A, Neuronal cytoplasm and proximal axon; B, axon terminal. A1, PAS-positive granules (purple color), which are indistinguishable from abnormal mitochondria, are anterogradely transported from the cytoplasm to the axon (blue color). A2, When abnormal mitochondria collapse, release of cyt c and ROS induces spheroid formation in the middle of the axon. The photograph shows an abnormal mitochondrion containing tubulovesicular and normal cristae at 56 weeks. The square in the photo is a high-magnification view of the white square. B1, Normal axon terminal with synaptic vesicles (yellow color). B2, The presynaptic membrane is abnormally expanded. B3, The presynaptic membrane and synaptic vesicles have disappeared, and degenerative membranes (purple color) are evident in the corresponding area. B4, A spheroid (pink color) with tubulovesicular structures has formed at the axon terminal. B5, Two types of tubulovesicular structures are attached to each other at the axon terminal. The distal one (pink color) shows a high density and the proximal one (blue color) a low density of tubulovesicular structures and PAS-positive granules. The photographs in the squares show two types of tubulovesicular structures observed at 100 weeks. The proximal tubulovesicular structure is followed by a swollen axon.

References

    1. Balsinde J, Balboa MA, Dennis EA. Antisense inhibition of group VI Ca2+-independent phospholipase A2 blocks phospholipid fatty acid remodeling in murine P388D1 macrophages. J Biol Chem. 1997;272:29317–29321. - PubMed
    1. Bao S, Miller DJ, Ma Z, Wohltmann M, Eng G, Ramanadham S, Moley K, Turk J. Male mice that do not express group VIA phospholipase A2 produce spermatozoa with impaired motility and have greatly reduced fertility. J Biol Chem. 2004;279:38194–38200. - PMC - PubMed
    1. Basselin M, Rosa AO, Ramadan E, Cheon Y, Chang L, Chen M, Greenstein D, Wohltmann M, Turk J, Rapoport SI. Imaging decreased brain docosahexaenoic acid metabolism and signaling in iPLA(2) β (VIA)-deficient mice. J Lipid Res. 2010;51:3166–3173. - PMC - PubMed
    1. Bäumer D, Ansorge O, Almeida M, Talbot K. The role of RNA processing in the pathogenesis of motor neuron degeneration. Expert Rev Mol Med. 2010;12:e21. - PubMed
    1. Burke JE, Dennis EA. Phospholipase A2 biochemistry. Cardiovasc Drugs Ther. 2009;23:49–59. - PMC - PubMed

Publication types

MeSH terms