. 2011 Aug 3;476(7358):57-62.
doi: 10.1038/nature10277.

On the growth and form of the gut

Affiliations

On the growth and form of the gut

Thierry Savin et al. Nature. .

Abstract

The developing vertebrate gut tube forms a reproducible looped pattern as it grows into the body cavity. Here we use developmental experiments to eliminate alternative models and show that gut looping morphogenesis is driven by the homogeneous and isotropic forces that arise from the relative growth between the gut tube and the anchoring dorsal mesenteric sheet, tissues that grow at different rates. A simple physical mimic, using a differentially strained composite of a pliable rubber tube and a soft latex sheet is consistent with this mechanism and produces similar patterns. We devise a mathematical theory and a computational model for the number, size and shape of intestinal loops based solely on the measurable geometry, elasticity and relative growth of the tissues. The predictions of our theory are quantitatively consistent with observations of intestinal loops at different stages of development in the chick embryo. Our model also accounts for the qualitative and quantitative variation in the distinct gut looping patterns seen in a variety of species including quail, finch and mouse, illuminating how the simple macroscopic mechanics of differential growth drives the morphology of the developing gut.


Figures

Figure 1
Figure 1. Morphology of loops in the chick gut
a, Chick gut at day 5 (E5), E8, E12, E16 (shows stereotypical pattern). b, Proliferation in the E5 (left) and E12 (right) gut tube (above in blue) and mesentery (below in red). Each blue bar represents the average number of phospho-H3 positive cells per unit surface in 40 (E5) or 50 (E12) 10µm sections. For the mesentery, each red bar represents the average number of phospho-H3 positive cells per unit surface over 6 10µm sections (E5), or in specific regions demarcated by vasculature along the mesentery (E12). The inset images of the chick guts align the proliferation data with the location of loops (all measurements were done in 3 or more chick samples). c, The gut and mesentery before and after surgical separation at E14 show that the mesentery shrinks while the gut tube straightens out almost completely. d, The E12 chicken gut under normal development (left) and after in ovo surgical separation of the mesentery at day 4 (right). Note the gut and mesentery repair their attachment, leading to some regions of normal looping (highlighted in green). However a portion of the gut lacks normal loops as a result of disrupting the gut-mesentery interaction over the time these loops would have otherwise developed.
Figure 2
Figure 2. Rubber simulacrum of gut looping morphogenesis
a, To construct the rubber model of looping, a thin rubber sheet (mesentery) is stretched uniformly along its length and then stitched to a straight unstretched rubber tube (gut) along its boundary; the differential strain mimics the differential growth of the two tissues. The system is then allowed to relax, free of any external forces. b, On relaxation, the composite rubber model deforms into a structure very similar to the chick gut (here, the thickness of the sheet is 1.3mm and its Young’s modulus is 1.3MPa, the radius of the tube is 4.8mm its thickness is 2.4mm, and its Young’s modulus is 1.1MPa, see Supplementary Information for details). c, Chick gut at embryonic day E12. The superior mesenteric artery has been cut out (but not the mesentery), allowing the gut to be displayed aligned without altering its loop pattern.
Figure 3
Figure 3. Morphometric and mechanical measurements of chick gut
a, Schematic summarizing the parameters involved in the physical model. b, inner and outer tube diameter. Measurements are extracted from DAPI stained tube cross section shown in insets. c, Tube and mesentery differential growth. Inset shows the length measurement on one isolated loop. d, Stress vs. extension for the mesentery at E8, E12 and E16. The curves are linearized at a characteristic strain corresponding to the physiological strain, as shown by the black lines, to extract the effective Young modulus Em and the effective strain ε0. e, Stress vs. strain curves for the gut tube at E8, E12 and E16. f, Mesentery and tube Young’s modulii Em, Et as a function of time, E8, E12, E16. g, effective differential growth strain ε0 as a function of time, E8, E12, E16.
Figure 4
Figure 4. Predictions for loop shape, size and number at 3 stages in chick gut development
a, Comparisons of the chicken gut E16 (top) with its simulated counterpart (bottom). b, Scaled loop contour length λ/r0 plotted vs. eq. (3a) for the chick gut (black squares), the rubber model (green triangles), and numerical simulations (purple circles), are consistent with the scaling law (1). c, Scaled loop radius R/r0, plotted vs. eq. (3b), for the chick gut, the rubber model, and numerical simulations, are consistent with the scaling law (2). Symbols are as in b.
Figure 5
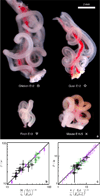
Figure 5. Comparative predictions for looping parameters across species
a, Gut looping patterns in the chick, quail, finch and mouse, to scale show qualitative similarities in the shape of the loops, although the size and number of loops vary substantially. b, Comparison of the scaled contour length λ/r0 vs. eq. (3a) are consistent with the scaling law (1) for the different species. Black symbols are for the animals shown in (a), other symbols are the same as in fig. 4b. c, Comparison of the scaled loop radius R/r0 vs. eq. (3b) are consistent with the scaling law (2) for the different species. Symbols are as in b. In b and c, points for chick E8-12–16, quail E12–15, finch E10–13 and mouse E14.5–16.5 are reported.

Comment in

References

    1. His W. Anatomie Menschlicher Embryonen. Leipzig, Germany: Verlag von F.C.W. Vogel; 1880.
    1. Thompson DW. On Growth and Form. Cambridge: Cambridge University Press; 1917.
    1. Johnson RL, Tabin CJ. Molecular models for vertebrate limb development. Cell. 1997;90:979–990. - PubMed
    1. Metzger RJ, Krasnow MA. Genetic control of branching morphogenesis. Science. 1999;284:1635–1639. - PubMed
    1. Hufnagel L, et al. On the mechanism of wing size determination in fly development. Proc. Natl. Acad. Sci. U. S. A. 2007;104:3835–3840. - PMC - PubMed

Publication types