

Nonlinear fitness landscape of a molecular pathway
- PMID: 21814515
- PMCID: PMC3140986
- DOI: 10.1371/journal.pgen.1002160
Nonlinear fitness landscape of a molecular pathway
Abstract
Genes are regulated because their expression involves a fitness cost to the organism. The production of proteins by transcription and translation is a well-known cost factor, but the enzymatic activity of the proteins produced can also reduce fitness, depending on the internal state and the environment of the cell. Here, we map the fitness costs of a key metabolic network, the lactose utilization pathway in Escherichia coli. We measure the growth of several regulatory lac operon mutants in different environments inducing expression of the lac genes. We find a strikingly nonlinear fitness landscape, which depends on the production rate and on the activity rate of the lac proteins. A simple fitness model of the lac pathway, based on elementary biophysical processes, predicts the growth rate of all observed strains. The nonlinearity of fitness is explained by a feedback loop: production and activity of the lac proteins reduce growth, but growth also affects the density of these molecules. This nonlinearity has important consequences for molecular function and evolution. It generates a cliff in the fitness landscape, beyond which populations cannot maintain growth. In viable populations, there is an expression barrier of the lac genes, which cannot be exceeded in any stationary growth process. Furthermore, the nonlinearity determines how the fitness of operon mutants depends on the inducer environment. We argue that fitness nonlinearities, expression barriers, and gene-environment interactions are generic features of fitness landscapes for metabolic pathways, and we discuss their implications for the evolution of regulation.
Conflict of interest statement
The authors have declared that no competing interests exist.
Figures
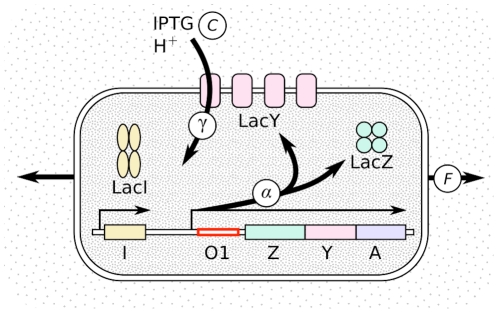
 and it depends on the sequence of lac O1, on the presence of inducer inside the cell, and on the growth rate. All three lac genes are transcribed with the same rate, hence LacZ can be used as a reporter for the whole operon. LacY transports molecules such as IPTG inside the cell with a rate
  , which depends on the concentration of these molecules. One proton
  is transported with each substrate molecule . Growth (measured by the Malthusian fitness
  ) dilutes the internal molecules, thus lowering their concentrations. The strains used in this study differ by the lacO1 sequence and are grown in various IPTG concentrations.
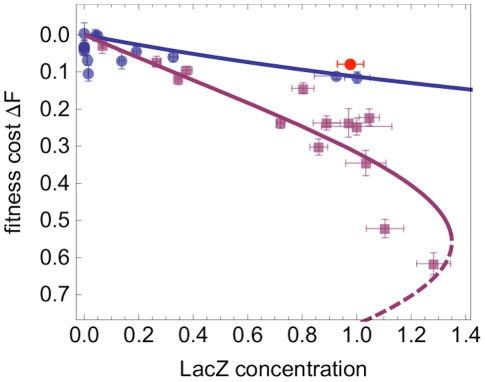
 . The fitness cost
  of a given strain is defined as the reduction in growth rate (Malthusian fitness) compared to the reference strain (see Materials and Methods for details). In presence of 1 mM IPTG, a control strain with deleted lac Y gene
  has an expression level comparable to the wild type, but a fitness close to that of constitutive mutants in absence of IPTG (red dot). All points show the average of 12 replicates for fitness and at least 3 replicates for protein concentration, with error bars giving the standard error. Lines show model predictions (the dashed line represents an unstable solution, see main text).

 of the lac pathway is shown as a function of the protein production rate
  and the transport rate
  . The fitness landscape obtained from our model (shaded surface) is strongly nonlinear and has two branches. The stable part of the landscape (solid shading) ends at a fitness cliff (solid blue line), beyond which populations cannot maintain growth. The remaining part of the lower fitness branch is unstable (striped shading). Protein expression and activity of viable populations are bounded by a barrier (dotted blue line). Model predictions of pathway phenotypes and fitness for individual strains under varying inducer concentrations are shown as a family of red lines (light red: wild type, dark red: operator mutant strains). Experimental fitness values are shown as dots (the offset from the model surface is marked by gray lines).
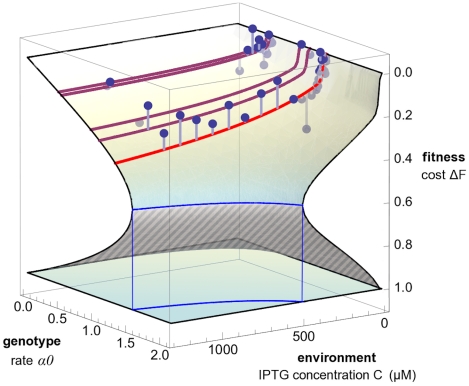
 of the lac pathway is shown as a function of the operator genotype summary variable
  (maximum rate of protein production at a growth of 1 cell division/hr, see text) and the external inducer concentration
  . The model fitness landscape is again strongly nonlinear: it has a stable upper branch (solid shading) and an unstable lower branch (striped shading) separated by a fitness cliff (blue line), similar to the phenotype-fitness map of Figure 4. Model predictions for individual strains under varying inducer concentrations are shown as a family of red lines (light red: wild type; dark red: operator mutant strains with
  equal to wild type value, see text). Experimental fitness values are shown as dots (the offset from the model surface is marked by gray lines).
References
-
- Carroll SB. Evo-devo and an expanding evolutionary synthesis: a genetic theory of morphological evolution. Cell. 2008;134:25–36. - PubMed
-
- Zamenhof S, Eichhorn HH. Study of microbial evolution through loss of biosynthetic functions: establishment of ‘defective’ mutants. Nature. 1967;216:456–458. - PubMed
-
- Andrews KJ, Hegeman GD. Selective disadvantage of non-functional protein synthesis in Escherichia coli. J Mol Evol. 1976;8:317–328. - PubMed
-
- Koch AL. The protein burden of lac operon products. J Mol Evol. 1983;19:455–462. - PubMed
-
- Vind J, Sørensen MA, Rasmussen MD, Pedersen S. Synthesis of proteins in Escherichia coli is limited by the concentration of free ribosomes. Expression from reporter genes does not always reect functional mRNA levels. J Mol Biol. 1993;231:678–688. - PubMed
Publication types
MeSH terms
Substances
LinkOut - more resources
Full Text Sources
