. 2011 Jul;7(7):e1002180.
doi: 10.1371/journal.pgen.1002180. Epub 2011 Jul 21.

Replication and explorations of high-order epistasis using a large advanced intercross line pedigree

Affiliations

Replication and explorations of high-order epistasis using a large advanced intercross line pedigree

Mats Pettersson et al. PLoS Genet. 2011 Jul.

Abstract

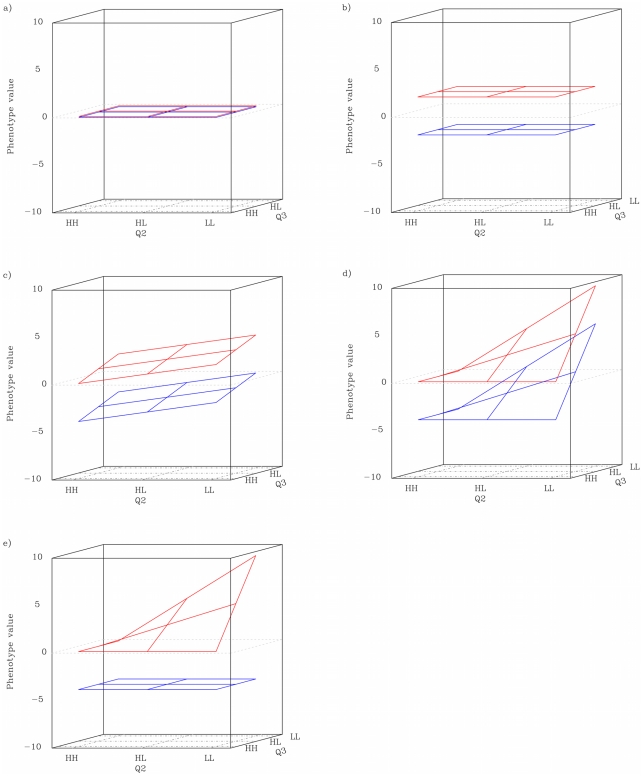
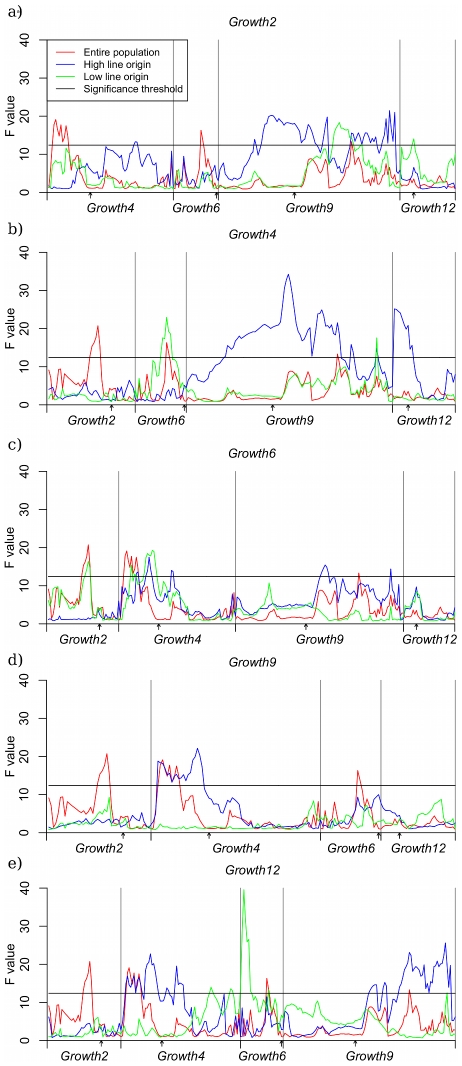
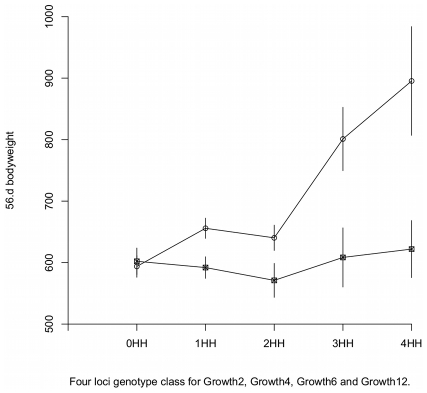
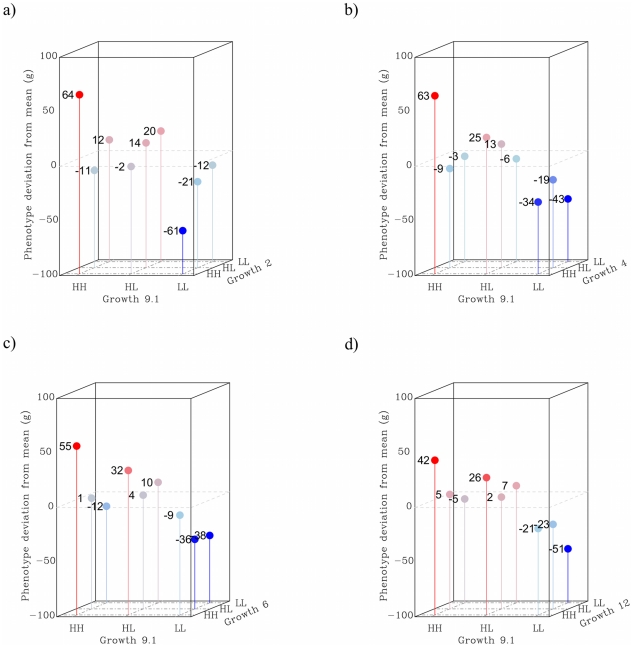
Dissection of the genetic architecture of complex traits persists as a major challenge in biology; despite considerable efforts, much remains unclear including the role and importance of genetic interactions. This study provides empirical evidence for a strong and persistent contribution of both second- and third-order epistatic interactions to long-term selection response for body weight in two divergently selected chicken lines. We earlier reported a network of interacting loci with large effects on body weight in an F(2) intercross between these high- and low-body weight lines. Here, most pair-wise interactions in the network are replicated in an independent eight-generation advanced intercross line (AIL). The original report showed an important contribution of capacitating epistasis to growth, meaning that the genotype at a hub in the network releases the effects of one or several peripheral loci. After fine-mapping of the loci in the AIL, we show that these interactions were persistent over time. The replication of five of six originally reported epistatic loci, as well as the capacitating epistasis, provides strong empirical evidence that the originally observed epistasis is of biological importance and is a contributor in the genetic architecture of this population. The stability of genetic interaction mechanisms over time indicates a non-transient role of epistasis on phenotypic change. Third-order epistasis was for the first time examined in this study and was shown to make an important contribution to growth, which suggests that the genetic architecture of growth is more complex than can be explained by two-locus interactions only. Our results illustrate the importance of designing studies that facilitate exploration of epistasis in populations for obtaining a comprehensive understanding of the genetics underlying a complex trait.


Conflict of interest statement

The authors have declared that no competing interests exist.

Figures

Figure 1
Figure 1. Schematic description of genotype-conditioned plane in different QTL patterns.
a): neither locus has any effect. b): the conditioning locus has a main effect but no interactions. c): all three loci have (non-interacting) main effects. d): the conditioning locus has a capacitating effect, and the two other loci display synergistic epistasis in the HH background. The red and blue planes represent the HH and LL genotype classes at the conditioning locus, respectively. The phenotype scale is arbitrary.
Figure 2
Figure 2. QTL scans on conditioned subsets of data.
Panel a contains the scan where Growth2 is the conditioning locus, in b, c, d and e, the conditioning loci are Growth4, Growth6, Growth9 and Growth12, respectively. Each panel shows the QTL profile in three data sets: HWS background (blue), LWS background (green) and the entire pedigree (red). Scans were performed for the non-transgressive loci in the radial network. The significance threshold represents 95% study-wide confidence based on a permutation test using 1000 replicates.
Figure 3
Figure 3. Genotype-phenotype maps in HWS and LWS genetic background at Growth9.1.
Model free estimation of phenotypic values. The values are plotted as a function of the degree of HWS and LWS homozygosity at its interacting loci Growth2, Growth4, Growth6 and Growth12. The error bars represent s.e.m. Circles are Growth9 HH and squares are Growth9 LL.
Figure 4
Figure 4. Two-way interactions in the radial QTL network.
Panel a shows the interaction between Growth9.1 and Growth2, where Growth2 on average has virtually no effect in this pedigree. However, stratification reveals that it has an effect, in opposite directions, in both the HH and LL background at Growth9.1. The remaining panels show the synergistic interactions between HH-alleles in the three pairings between Growth9.1 and Growth4 (b), Growth6 (c) and Growth12 (d) in turn.
Figure 5
Figure 5. Three-way epistatic interactions.
Panel a shows the mean phenotype values for each genotype for the triplet Growth1-Growth6-Growth12; panel b shows the same for the triplet Growth4-Growth9.1-Growth12. The values shown are the mean (over all individuals with that genotype) of the difference from the average for the class – that is all individuals with the same sex and belonging to the same generation. Thus, positive values in the graph indicate that individuals carrying that genotype are, on average, larger than expected for their class. Panel c shows the distribution of phenotype values for the Growth1-Growth6-Growth12 triplet, and panel d shows the same for the Growth4-Growth9.1-Growth12 triplet. The red “+” symbols show individuals with the high-weight genotype, the blue “x”-symbols indicate individuals with the low weight genotype. The correspondingly coloured circles show the genotype mean. Phenotypic values for all individuals are shown as black circles and the inserted histograms show the phenotype distributions for the high-weight (red) and low-weight (blue) genotypes. The expected range based on the additive effects of the loci is shown as dashed grey lines.

Similar articles

Cited by

References

    1. Andersson L, Georges M. Domestic-animal genomics: deciphering the genetics of complex traits. Nature reviews. Genetics. 2004;5:202–12. - PubMed
    1. Brem RB, Storey JD, Whittle J, Kruglyak L. Genetic interactions between polymorphisms that affect gene expression in yeast. Nature. 2005;436:701–3. - PMC - PubMed
    1. Evans DM, Marchini J, Morris AP, Cardon LR. Two-stage two-locus models in genome-wide association. PLoS Genet. 2006;2:e157. doi: 10.1371/journal.pgen.0020157. - DOI - PMC - PubMed
    1. Perola M, Sammalisto S, Hiekkalinna T, Martin NG, Visscher PM, et al. Combined genome scans for body stature in 6,602 European twins: evidence for common Caucasian loci. PLoS Genet. 2007;3:e97. doi: 10.1371/journal.pgen.0030097. - DOI - PMC - PubMed
    1. Zhang X-S, Hill WG. Change and maintenance of variation in quantitative traits in the context of the Price equation. Theoretical population biology. 2010;77:14–22. - PubMed

Publication types