. 2011 Aug 5;146(3):359-71.
doi: 10.1016/j.cell.2011.07.007.

Directed conversion of Alzheimer's disease patient skin fibroblasts into functional neurons

Affiliations

Directed conversion of Alzheimer's disease patient skin fibroblasts into functional neurons

Liang Qiang et al. Cell. .

Retraction in

Abstract

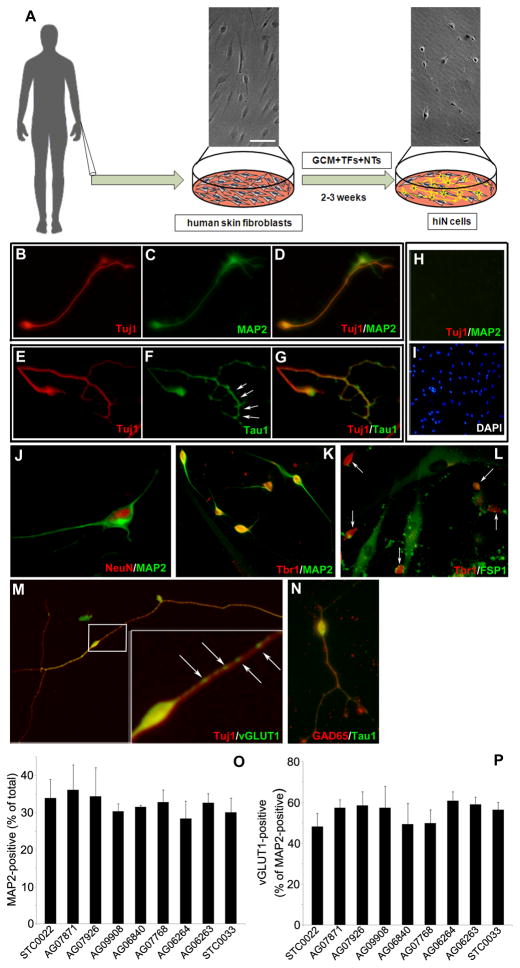
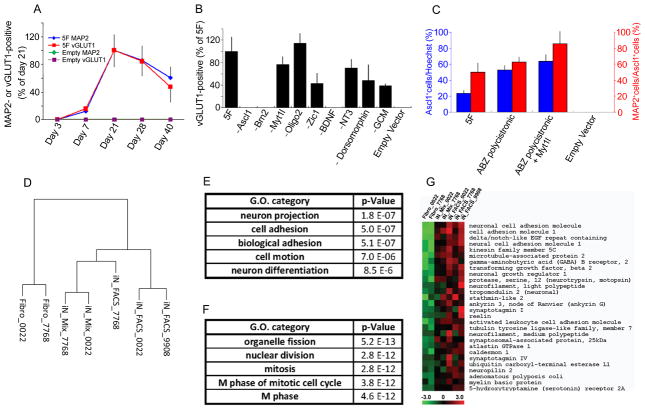
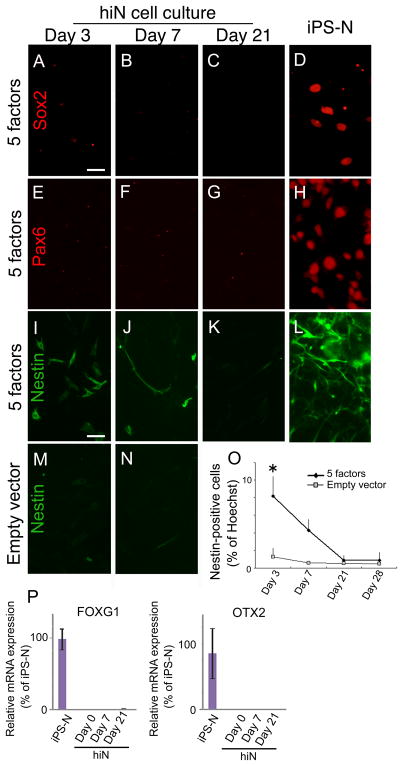
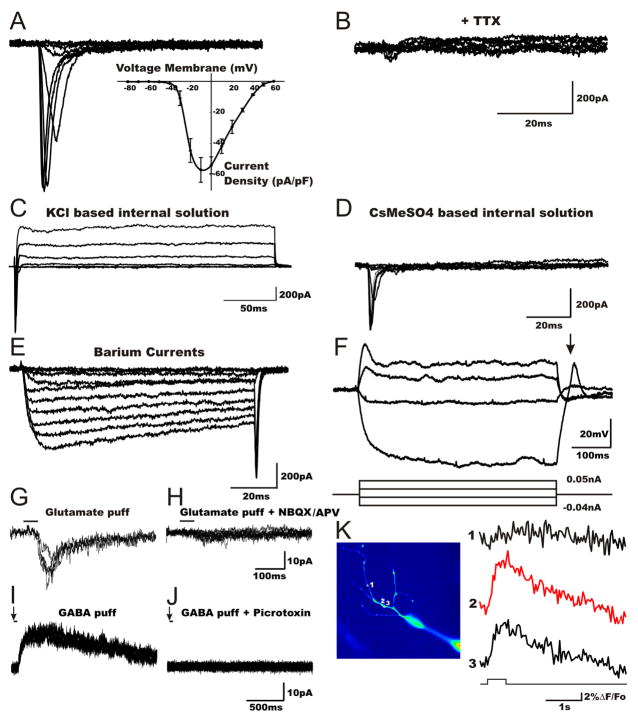
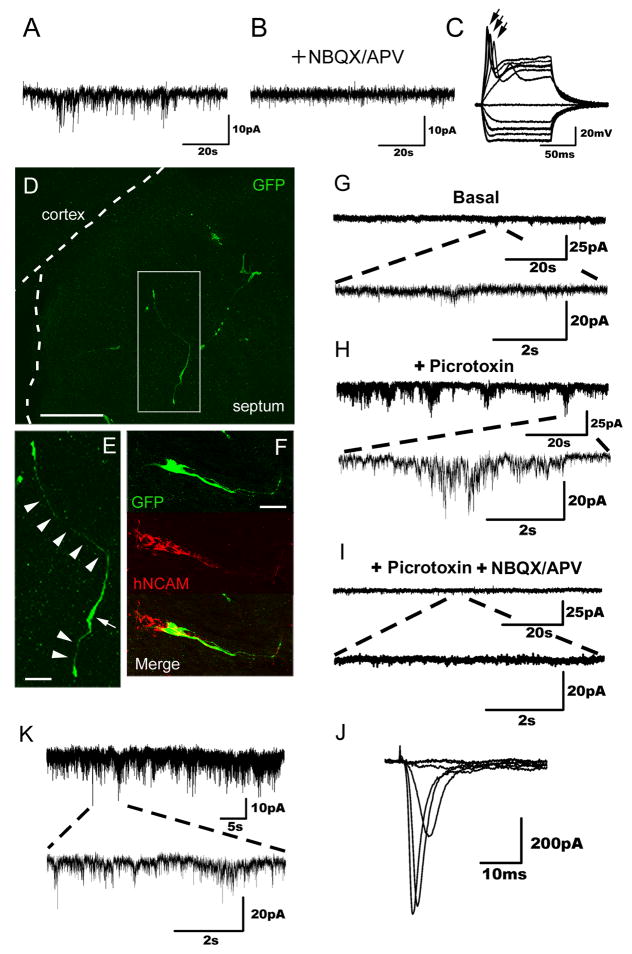
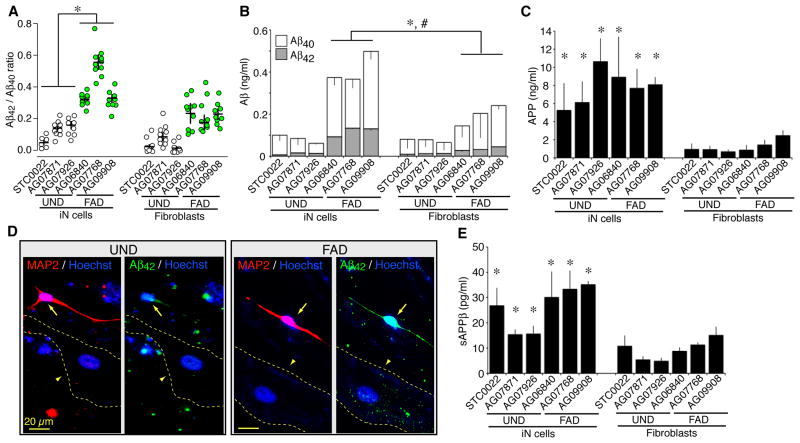
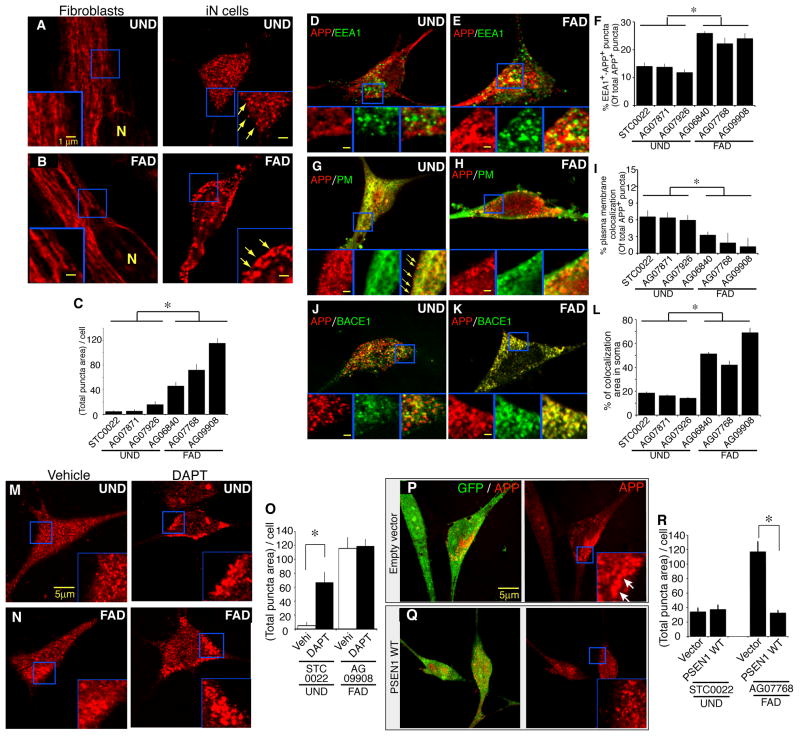
Directed conversion of mature human cells, as from fibroblasts to neurons, is of potential clinical utility for neurological disease modeling as well as cell therapeutics. Here, we describe the efficient generation of human-induced neuronal (hiN) cells from adult skin fibroblasts of unaffected individuals and Alzheimer's patients, using virally transduced transcription regulators and extrinsic support factors. hiN cells from unaffected individuals display morphological, electrophysiological, and gene expression profiles that typify glutamatergic forebrain neurons and are competent to integrate functionally into the rodent CNS. hiN cells from familial Alzheimer disease (FAD) patients with presenilin-1 or -2 mutations exhibit altered processing and localization of amyloid precursor protein (APP) and increased production of Aβ, relative to the source patient fibroblasts or hiN cells from unaffected individuals. Together, our findings demonstrate directed conversion of human fibroblasts to a neuronal phenotype and reveal cell type-selective pathology in hiN cells derived from FAD patients.


Figures

Figure 1
Figure 1. hiN cells display a forebrain glutamatergic neuron phenotype
(A) Schematic of the conversion method. Upper panels show phase contrast images of human skin fibroblast (left) or hiN cell (right) cultures. TFs, lentiviral vectors encoding transcription regulators Ascl1, Brn2, Myt1l, Olig2 and Zic1; NTs, Neurotrophins BDNF and NT3; GCM, glial-conditioned medium. (B–G) Neuronal marker analysis of hiN cell cultures. Human skin fibroblasts (STC0022; see Table S1) were transduced with the 5 transcription regulators, cultured for 3 weeks as in (A), and subsequently immunostained with antibodies specific to Tuj1 (B and E; in red), MAP2 (C; in green), or Tau-1 (F; in green). (D) is the merged image of (B) and (C); (G) is the merged image of (E) and (F). Arrows in (F) indicate the typical distal enrichment pattern of Tau1 antibody immunostaining. (H and I) Absence of neuronal markers in lentiviral vector-only transduced fibroblast cultures. Human skin fibroblasts (line STC0022) transduced with control lentiviral vector only were cultured for 3 weeks as above and analyzed for expression of Tuj1 (in red; H) and MAP2 (in green; H). Cultures were counterstained with the nuclear marker 4,6- diamidino-phenylindole (I; DAPI; in blue). Neuronal marker expression was not detected. (J) Co-staining of hiN culture with the neuronal nuclear marker NeuN (red) and MAP2 (green) is shown. (K and L) Forebrain marker expression in hiN cells. The majority of hiN cells expressed the neocortical glutamate neuron nuclear marker Tbr1 (K and L; in red) along with MAP2 (K; in green). In contrast, Tbr1-positive hiN cells were not stained by the fibroblast marker Fibroblast Specific Protein-1 (L; FSP1; in green). Arrows in (L) demarcate Tbr1-positive nuclei. (M) A majority of Tuj-1 positive hiN cells expressed the glutamatergic neuron marker vGLUT1 (in green). Inset shows magnified view of the boxed region in; arrows indicate the typical vGLUT1-positive punctate pattern. (N) Only rare (<1%; in green) hiN Tau-1 positive cells also stained positively for GAD65 (in red). (O and P) Quantification of MAP2 and vGLUT1 positive cells in hiN cell cultures derived from a panel of 9 human fibroblast lines. (O) Black bars indicate the percent of total cells that are MAP2-positive cells with extended processes (at least 3-fold greater than soma diameter, as in [F]). (P) Black bars indicate the percent of MAP2-positive cells that stain for the glutamatergic neuron marker vGLUT1 as in (M). N=3 wells for each group; data are presented as mean ± SEM. See also Figure S1 and Table S1. Scale bar: 10 μm (J) and the inset of (M); 20 μm (B) to (G), (K) to (L), and (N); 40 μm (A), (H), (I) and (M). See also Figure S1.
Figure 2
Figure 2. Further description of hiN cell conversion: essential factors and transcriptome analysis
(A) Temporal profile of hiN cell conversion. MAP2- or vGLUT1-positive cells were quantified at indicated time points after transduction with conversion factor vectors (5F; indicated as blue or red line) or empty vector (Empty; green or purple line). The number of MAP2 (diamond) and vGLUT1 (square) -positive cells peaked at 21 days after 5F transduction, whereas such cells were not apparent with empty vector. N=3 at each time point; data are presented as mean ± SEM. (B) Required factors in hiN cell conversion. Fibroblasts were transduced with the 5-factor (5F) cocktail as above, or with factor mixes lacking the indicated individual factors. Bar graphs indicate the number of vGLUT1-positive cells at 3 weeks after transduction, as a percent of 5F transduction. GCM, glial-conditioned media. N=3 per group. (C) Fibroblasts were transduced with a polycistronic vector harboring Ascl1, Brn2, and Zic1 (ABZ-polycistronic) alone or in combination with a Myt1l vector. The percentage of Ascl1-positive cells per total cell number (Hoechst positive nuclei; blue bars) reflects the transduction efficiency. The percentage of MAP2-positive hiN cells of transduced Ascl1-positive cells (red bars) reflects the hiN cell conversion efficiency. N=3 per group. (D) Dendrogram presenting the hierarchical clustering of gene expression array profiles as measured by Human Genome U133 Plus 2.0 Arrays (Affymetrix). Complete linkage hierarchical clustering analysis was performed using Pearson’s correlation metric. The dendrogram includes individual samples from FACS-sorted hiN cells (iN_FACS), unsorted hiN cell cultures (iN_Mix), or the original fibroblasts (Fibro). Samples are labeled as to the fibroblast of origin (see Table S1). hiN cell preparations clustered together, rather than with the originating fibroblast preparations. (E and F) The five most significantly enriched gene ontology (GO) categories among the genes upregulated (E) or downregulated (F) in the context of hiN cell conversion are presented. Expression data were analyzed using a False Discovery Rate of less than 25% and a log-ratio threshold of >2. Nominal p-values are listed. (G) Heat map specifying the genes and expression values within the GO category “Neuron projection” as in (E). Relative expression levels of individual genes (as labeled on rows) are presented from low (green) to high (red) as per the color chart bar at the bottom. Cell samples are labeled as per the (D). See also Figures S2 and S3 and Table S2.
Figure 3
Figure 3. hiN cell reprogramming is directed
(A–H) Progenitor markers are not detected in hiN cell cultures. Sox2 (A–C) and Pax6 (EG) expression were not detected during hiN cell reprogramming at 3, 7, and 21 days after transduction. In contrast, human iPSC cultures differentiated towards a neuroblast stage (IPS-N; D, H) displayed prominent intranuclear expression of the factors. Scale bar, 20 μm. (I–N) Nestin is transiently expressed in a subset of cells within hiN cell cultures (I–K), albeit less robustly than in iPS-N cells (L). Staining was not apparent in empty vector transduced cells (M, N). (O) Temporal profile of Nestin-positive cells in hiN cell cultures or empty vector-transduced skin fibroblasts. n = 3 at each time point; *, P<0.05 by ANOVA with Bonferroni correction. (P) Quantitative real time RT-PCR analysis of neural progenitor marker gene expression in hiN cell cultures at 0, 7, or 21 days after transduction as indicated, or in iPSC-N cells. Expression levels are normalized to GAPDH; error bars represent the standard error of the mean (SEM); n>9 per group.
Figure 4
Figure 4. Electrophysiological characterization and evoked calcium transients of cultured hiN cells
(A) An example voltage clamp recording from an hiN cell. Stepping the membrane voltage from −80 mV to more depolarized potentials (−70 to +60 mV in 10 mV increments) resulted in fast inward currents in 18 of 22 cell analyzed. Shown are example traces between −40 to 0 mV. Inset illustrates the pooled current density-voltage relationship (error bars represent the SEM). (B) The fast inward currents were sensitive to bath application of the Na+ channel blocker tetrodotoxin (TTX, 600 nM). (C) Outward K+ currents were obtained (in 14 of the 16 hiN cells recorded) with a KCl-based pipette solution upon depolarizing steps as described above. (D) Minimal or no outward K+ currents were observed in cells recorded with a Cs+ based pipette solution, as expected, but note the presence of the inward sodium currents. (E) Macroscopic whole cell voltage-dependent Ca2+ channel activity of hiN cells was identified using barium as the charge carrier. Currents were elicited in response to depolarizing steps (in 3 of the 4 hiN cells analyzed). (F) In current clamp mode, hiN cells exhibited a rebound action potential (arrow) at the end of hyperpolarizing current injections, and action potentials upon depolarizing current injection. Lower panel is a time schematic of the current injection protocol. (G) Glutamate mediated postsynaptic currents (PSCs) were elicited by focal application of 1mM glutamate puffs for 50 msec in cells voltage clamped at −70 mV; shown are 3 traces elicited once every 3 min. (H) Induced PSCs were sensitive to the AMPA channel blocker NBQX (20 μM) (2,3-dihydroxy-6-nitro-7 sulphamoyl-benzo [f] quinoxaline-2,3-dione) and the NMDA blocker APV (50 μM). (I) Focal application of GABA (50 msec puff, 1 mM) to cells voltage clamped at +20 mV and dialyzed with a low Cl solution elicited current responses; shown are 3 traces evoked every 3 min. (J) GABA mediated currents were sensitive to the GABAA antagonist picrotoxin (50 μM). Puff applications of neurotransmitter are indicated by a solid line above tracings. (K) Left panel: Fluorescence pseudocolor image of a complex axon-like process in an hiN cell dialyzed with 100 μM of the calcium indicator OG-1 (Oregon Green 488 BAPTA-1). Right panel: Time courses of the relative change in fluorescence (ΔF/F0) in individual regions of interest (ROIs), as numbered in the right panel. Calcium transients were evoked by 200 msec depolarizing pulses (Vh= −70 to 0 mV) in the soma. ROIs #2 and #3 display calcium transients (hot spots), but no response was elicited in ROI #1.
Figure 5
Figure 5. Evidence of hiN cell functional integration
(A) Representative spontaneous postsynaptic currents recorded from an hiN cell present in a murine glial monolayer co-culture. The cell was held at −70mV. Events of various amplitudes (5–20 pA) are seen. (B) Spontaneous postsynaptic currents as observed in (A) were abolished by bath application of NBQX/APV. (C) Upon depolarizing current injections in current-clamp mode, action potentials were induced. Individual traces represent independent recorded events; action potentials (indicated by arrows) were seen in 5 of the 9 tracings. (D–E) Confocal fluorescent images of brain slices prepared from postnatal day 3 animals that had been grafted in utero with hiN cells. Transplanted hiN cells migrated extensively and extended neurite processes. An arrowhead indicates cell soma; arrows point to apparent processes. Scale bar, 100 μm (D), 20 μm (E). (F) Confocal reconstruction of a transplanted GFP-positive hiN cell stained with a human-specific NCAM antibody. GFP, green; hNCAM, red; Scale bar, 50 μm. (G) Voltage clamp recording of an hiN cell (Vh=−70 mV) integrated into the piriform cortex of the host brain, demonstrating spontaneous events of low frequency and amplitude. (H) The frequency and amplitude of the spontaneous excitatory postsynaptic currents (sEPSCs, as in G) increased upon blockade of GABAA receptors with 50 μM picrotoxin. (I) sEPSCs were drastically reduced by blocking glutamatergic synaptic transmission with 20 μM NBQX and 50 μM APV. (J) Sodium currents of the same cell (G–I) elicited by voltage steps from Vh=−70 (−60 to 20 in 10 mV steps). (K) Representative voltage clamp recording at a holding potential (Vh= −70 mV) of an hiN cell integrated into the cingulate gyrus of the host brain. Traces show spontaneous slow and fast currents of different amplitudes, indicating that this neuron receives synaptic contacts from host cells. See also Figure S4 and Table S3.
Figure 6
Figure 6. Modified APP processing in FAD hiN cell cultures
(A) The Aβ42/Aβ40 ratio is selectively increased in FAD hiN cell cultures relative to UND hiN cell cultures or fibroblasts. Media from hiN cell cultures (at 3 weeks post-transduction; empty circles) or fibroblast cultures (green circles), as indicated, was assayed for secreted Aβ40 and Aβ42 by sandwich ELISA. Results represent the mean ± SEM. N=3 individual lines per group, with 11 to 16 independent wells for each line. *, P < 0.05 by ANOVA with post-hoc Tukey HSD test. (B) Total absolute extracellular Aβ levels (Aβ40 [white bars] + Aβ42 [grey bars]) are presented for cultures as in (A). Total Aβ was increased by neuronal hiN cell conversion in the context of FAD patient cultures. In contrast, UND fibroblast cultures were not significantly different from UND hiN cell cultures. N= 3 individual lines per group, with 11 to 16 independent wells for each line. *, P < 0.05. (C) Quantification of total intracellular APP holoprotein using sandwich ELISA. APP is enriched in hiN cell cultures relative to fibroblast precursors (*, P < 0.05 for all comparisons.), but UND and FAD genotypes do not differ significantly. Results represent the means ± SEM (n=6–9 wells per group). *, P < 0.05. (D) MAP2-positive neuronal cells within the hiN cultures are enriched for the Aβ42 fragment, compared to fibroblastic MAP2-negative cells. FAD and UND hiN cell cultures were immunostained with antibodies to MAP2 (left panels, in red) along with Aβ42 (right panels, in green); nuclei are identified by Hoechst staining (blue). MAP2-negative fibroblastic cells (demarcated with dotted lines) display low levels of Aβ42 relative to the MAP2-positive cells, as quantified in Figure S5J. (E) Accumulation of sAPPβ in the media of UND and FAD cultures, as determined by sandwich ELISA. Results represent the means ± SEM; n=4–5 wells per individual line. See also Figure S5.
Figure 7
Figure 7. APP is enriched within modified endocytic compartment puncta in FAD hiN cells
(A, B) APP immunostaining of hiN cells (right panels) derived from representative UND (A; AG07926) and FAD (B; AG09908) cultures labels punctate structures typical of endocytic compartment vesicles. In contrast, control fibroblast cultures display a distinct labeling pattern, with sparse punctate morphology (left panels). Insets show high magnification views for visualization of APP-positive puncta (arrows). N; nuclei. (C) Quantification of APP-positive total puncta area per cell (μm2; number of puncta per cell X average puncta area) in individual UND and FAD hiN cell cultures as labeled. Total APP-positive puncta area was significantly increased in FAD hiN cultures, relative to UND cultures, as a consequence of increased puncta size and number. Results represent mean ± SEM (n=12–38 cells in a total of 6 wells per group). *, P < 0.05. (D–F) Colocalization of APP-positive puncta with the early endosomal marker EEA1 in UND and FAD hiN cells. APP-positive puncta (in red) appeared partially co-localized with EEA1 (in green), and this was most prominent in FAD (E) relative to UND (D) cultures. Colocalization was visualized as yellow in the merged images. Inset panels present merged as well as individual staining patterns, for visualization of areas as demarcated by a blue square. (F) Quantification of APP and EEA1 colocalization by fluorescent microscopy as in (E). Puncta are defined here as distinct signal intensities 0.1 to 1 μm in diameter using Image J analysis software (NIH). (G–I) A subset of APP-positive puncta is co-stained with a plasma membrane marker at the cell periphery (PM; in green). In contrast to EEA1 co-staining, peripheral plasma membrane marker co-staining appears reduced in the FAD hiN cells (H) relative to UND hiN cells (G). Insets are high-magnification views of areas demarcated by blue squares. Arrows point to examples of APP puncta at cell cortex. Quantification of colocalization by fluorescent microscopy is shown in (I). (J–L) Double immunostaining of hiN cells for APP and BACE1. Colocalization of APP and BACE1 was assessed in UND (J) and FAD (K) hiN cells. Quantification of the data show increased colocalization in the FAD cultures, consistent with the preferential localization to intracellular endocytic vesicles (L). All results represent the means ± SEM (n=35–48 cells in 3–6 independent wells per group). *, P < 0.05. (M–O) Enlarged APP-positive puncta in UND hiN cells treated with the γ-secretase inhibitor DAPT. UND (M; AG07926) and FAD (N; AG09908) hiN cells were treated with either vehicle (left panels) or DAPT (right panels) for 18 hours and then fixed and stained with an antibody to the APP amino-terminus. Insets at lower right show high magnification views for visualization of enlarged APP-positive puncta. (O) Quantification revealed that γ-secretase inhibitor treatment led to a significant increase in total APP-positive puncta area per cell within UND but not FAD cultures. Results represent mean ± SEM (n=35–50 cells in 3 independent wells). *, P < 0.05. (P–R) Rescue of the endosomal APP-positive endocytic phenotype in PSEN1 mutant FAD hiN cells. UND (P; STC0022) and PSEN1 mutant FAD (Q; AG07768) hiN cell cultures were transfected with an expression vector for human wild type PSEN1 or empty vector (along with EGFP to mark transfected cells). Cultures were incubated for an additional 72 h and subsequently immunostained for APP. Results represent the mean ± SEM (n=35–50 cells in 3 independent wells per group). *, P < 0.05. See also Figure S6.

Comment in

References

    1. Abeliovich A, Doege CA. Reprogramming therapeutics: iPS cell prospects for neurodegenerative disease. Neuron. 2009;61:337–339. - PMC - PubMed
    1. Alzheimer A. Uber eine eigenartige Erkrankung der Hirnrinde. Allg Z Psychiat Psych-Gerichtl Med. 1907;64:146–148.
    1. Bentahir M, Nyabi O, Verhamme J, Tolia A, Horre K, Wiltfang J, Esselmann H, De Strooper B. Presenilin clinical mutations can affect gamma-secretase activity by different mechanisms. J Neurochem. 2006;96:732–742. - PubMed
    1. Brustle O, Spiro AC, Karram K, Choudhary K, Okabe S, McKay RD. In vitro-generated neural precursors participate in mammalian brain development. Proc Natl Acad Sci U S A. 1997;94:14809–14814. - PMC - PubMed
    1. Cataldo AM, Barnett JL, Pieroni C, Nixon RA. Increased neuronal endocytosis and protease delivery to early endosomes in sporadic Alzheimer’s disease: neuropathologic evidence for a mechanism of increased beta-amyloidogenesis. J Neurosci. 1997;17:6142–6151. - PMC - PubMed

Publication types