. 2011 Aug 5;146(3):408-20.
doi: 10.1016/j.cell.2011.06.034.

mTOR complex 1 regulates lipin 1 localization to control the SREBP pathway

Affiliations

mTOR complex 1 regulates lipin 1 localization to control the SREBP pathway

Timothy R Peterson et al. Cell. .

Abstract

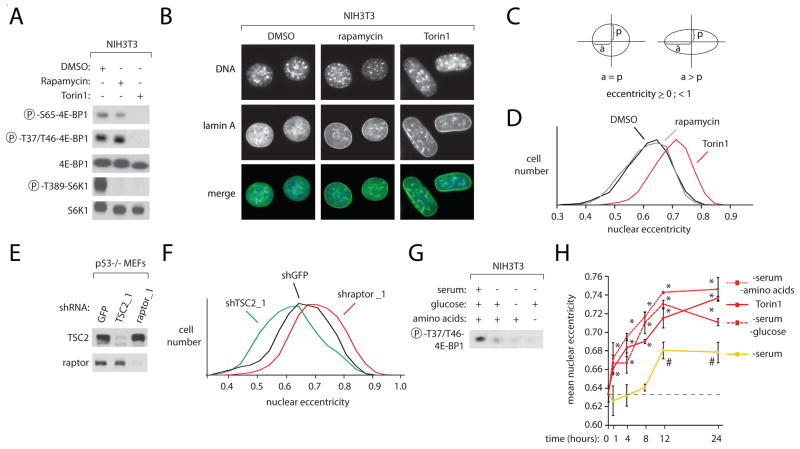
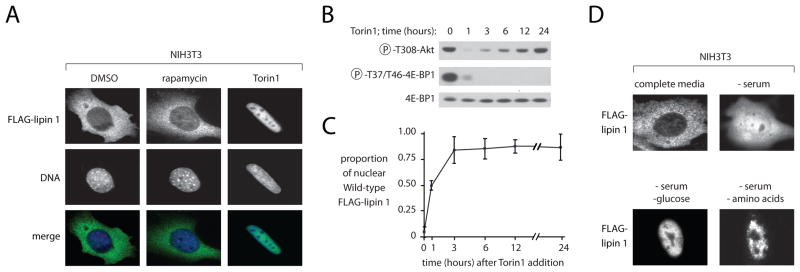
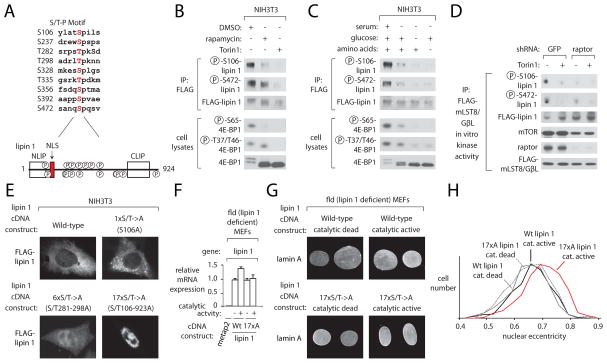
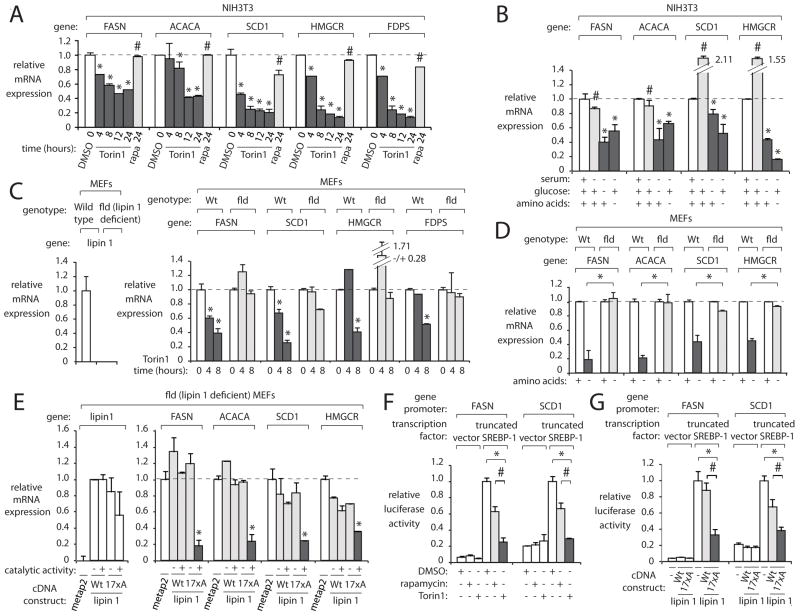
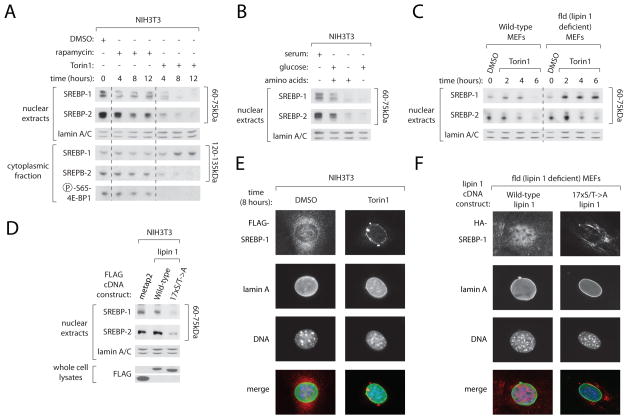
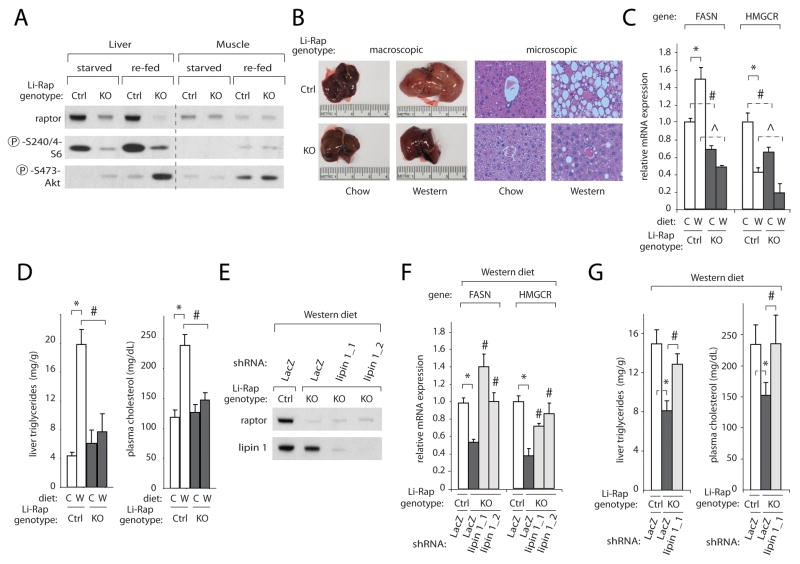
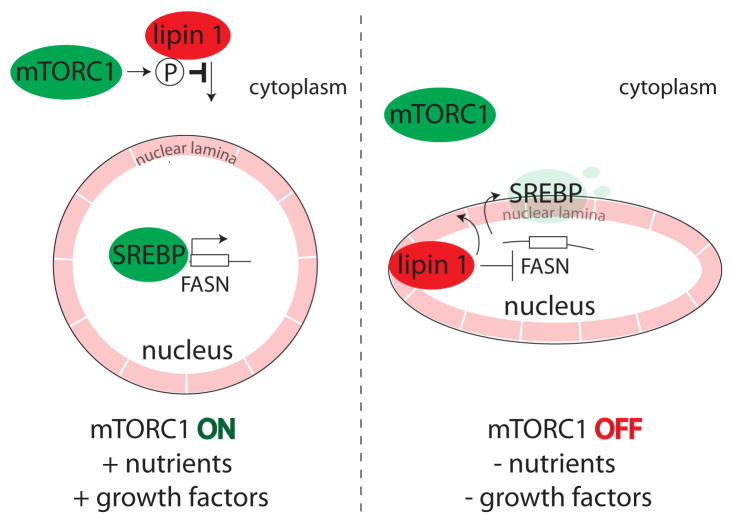
The nutrient- and growth factor-responsive kinase mTOR complex 1 (mTORC1) regulates many processes that control growth, including protein synthesis, autophagy, and lipogenesis. Through unknown mechanisms, mTORC1 promotes the function of SREBP, a master regulator of lipo- and sterolgenic gene transcription. Here, we demonstrate that mTORC1 regulates SREBP by controlling the nuclear entry of lipin 1, a phosphatidic acid phosphatase. Dephosphorylated, nuclear, catalytically active lipin 1 promotes nuclear remodeling and mediates the effects of mTORC1 on SREBP target gene, SREBP promoter activity, and nuclear SREBP protein abundance. Inhibition of mTORC1 in the liver significantly impairs SREBP function and makes mice resistant, in a lipin 1-dependent fashion, to the hepatic steatosis and hypercholesterolemia induced by a high-fat and -cholesterol diet. These findings establish lipin 1 as a key component of the mTORC1-SREBP pathway.


Figures

Figure 1
Figure 1. mTORC1 regulates nuclear eccentricity in a rapamycin-resistant manner
(A) NIH3T3 cells treated with 100 nM rapamycin, 250 nM Torin1 or vehicle for 12 hours were analyzed by immunoblotting for the phosphorylation states and levels of the indicated proteins. (B) NIH3T3 cells treated with 100 nM rapamycin, 250 nM Torin1 or vehicle for 12 hours were processed in an immunofluorescence assay to detect lamin A (green), costained with DAPI for DNA content (blue), and imaged. Illustrative nuclei for each condition are shown. (C) Explanation of eccentricity. The eccentricity of an elliptical object is a measure of how much the shape of the ellipse deviates from being circular. Defined mathematically, eccentricity=1−2/((a/p)+1), where a is the radius at apopasis, i.e., the farthest distance from the edge of the ellipse to its center, and p is the radius at periapsis, i.e., the closest distance to ellipse center. The eccentricity of an ellipse is necessarily between 0 and 1; a circle has an eccentricity of 0. As the eccentricity tends to 1, the ellipse becomes more elongated, and the ratio of a/p tends to infinity. (D) Images processed in (B) were analyzed for nuclear eccentricity based on lamin A immunofluorescence by image analysis software (Carpenter et al., 2006). Nuclear eccentricity distributions of rapamycin and Torin1 treated cells were overlaid with those from corresponding vehicle treated cells. Mean. eccentricity values for three independent fields for each condition (>500 cells total) are: DMSO (black) 0.630; rapamycin (grey) 0.628; Torin1 (red) 0.704. (E) Immunoblot analysis of TSC2 and raptor protein levels in p53−/− MEFs with RNAi-mediated knockdown of a control protein, TSC2, or raptor. (F) p53−/− MEFs with knockdown of TSC2, raptor, or a control protein were analyzed as in (D). Mean eccentricity values for three independent fields for each condition (>500 cells total) are: shGFP (black) 0.660; shTSC2_1 (green) 0.622; shraptor_1 (red) 0.705. (G) Immunoblot analysis of T37/T46 4E-BP1 phosphorylation in NIH3T3 cells deprived of serum, serum and glucose, or serum and amino acids for 12 hours. (H) NIH3T3 cells treated with 250nM Torin1 or deprived of serum, serum and glucose, or serum and amino acids for the indicated times were analyzed as in (D). The mean eccentricity value for untreated cells is 0.633 (dashed line). Error bars indicate standard error for n=3. * indicates p<0.03; # indicates p<0.01.
Figure 2
Figure 2. Lipin 1 cytoplasmic-nuclear distribution is regulated by mTORC1, growth factors, and nutrients
(A) NIH3T3 cells overexpressing FLAG-lipin 1 were treated with 100 nM rapamycin, 250 nM Torin1 or vehicle for 8 hours. Cells were then processed in an immunofluorescence assay to detect FLAG (green), costained with DAPI for DNA content (blue), and imaged. (B) FLAG-lipin 1 overexpressing NIH3T3 cells were treated with 250 nM Torin1 for the specified times and analyzed by immunoblotting for the phosphorylation states and levels of the indicated proteins. (C) Cells treated as in (B) were processed in an immunofluorescence assay to detect FLAG, costained with DAPI for DNA content, and imaged. The overlap of FLAG immunoreactivity with DAPI staining was analyzed for >500 cells total. Error bars indicate standard error for n=3. (D) NIH3T3 cells overexpressing FLAG-lipin 1 were grown in complete media or deprived of serum, serum and glucose, or serum and amino acids for 8 hours and imaged as in (A).
Figure 3
Figure 3. mTORC1-catalyzed lipin 1 phosphorylation regulates lipin 1 localization and nuclear eccentricity
(A) Schematic of the location of lipin 1 phosphorylation sites. NLIP, N-terminal lipin 1 conserved region. CLIP, C-terminal lipin 1 conserved region. NLS, Nuclear Localization Signal (in red). Capitalized serine or threonine residues (in red) indicate the lipin 1 phosphorylation sites which are followed in the +1 position by a proline residue. (B) NIH3T3 cells transfected with FLAG-lipin 1 were treated with 100 nM rapamycin, 250 nM Torin1, or vehicle for 4 hours. FLAG immunoprecipitates and cell lysates were analyzed by immunoblotting for the phosphorylation states and levels of the specified proteins. (C) NIH3T3 cells transfected with FLAG-lipin 1 were grown in complete media or deprived of serum, serum and glucose, or serum and amino acids for 4 hours. (D) HEK-293T cells overexpressing FLAG-mLST8/GβL were infected with lentivirus expressing an shRNA targeting raptor or GFP. FLAG immunoprecipitates analyzed for mTOR kinase activity toward lipin 1 in the presence of 250 nM Torin1 or vehicle. (E) FLAG-Wild-type, 1xS/T->A, 6xS/T->A, and 17xS/T->A lipin 1 overexpressing NIH3T3 cells were processed in an immunofluorescence assay to detect FLAG and imaged. (F) Indicated FLAG-tagged lentiviral expression vectors were stably introduced into fld cells and RNA was isolated 5 days post-infection. All mRNAs were measured by qRT-PCR and normalized to 36B4 mRNA levels. Error bars indicate standard error for n=4. (G) Each lipin 1-expressing cell line generated as in (F) was processed in an immunofluorescence assay to detect lamin A and imaged. (H) Images processed in (G) were analyzed for nuclear eccentricity as in Figure 1D. Mean eccentricity values for three independent fields for each condition (>500 cells total) are: catalytic dead, wild-type lipin 1 (grey) 0.666; catalytic dead, 17xS/T->A lipin 1 (grey hatched line) 0.671; catalytically active, wild-type lipin 1 (black) 6.76; catalytically active, 17xS/T->A lipin 1 (red) 0.713.
Figure 4
Figure 4. mTORC1-regulated lipin 1 relocalization is necessary and sufficient to repress SREBP-dependent transcription
(A) NIH3T3 cells were treated with 100 nM rapamycin, 250 nM Torin1, or vehicle for the indicated times. All mRNAs were measured by qRT-PCR and normalized to 36B4 mRNA levels. Error bars indicate standard error for n=4. * indicates p<0.04; # indicates p<0.02. (B) NIH3T3 cells were grown in complete media, deprived of serum, serum and glucose, or serum and amino acids for 12 hours. All mRNAs were analyzed as in (A). Error bars indicate standard error for n=4. * indicates p<0.02; # indicates p<0.03. (C) Wild-type or fld MEFs were treated with 250 nM Torin1 or vehicle for the indicated times. All mRNAs were measured by qRT-PCR and normalized to 36B4 mRNA levels. * indicates p<0.02. (D) Wild-type or fld MEFs were deprived of serum or serum and amino acids for 8 hours. All mRNAs were analyzed as in (C). * indicates p<0.01. (E) Indicated FLAG-tagged lentiviral expression vectors were stably introduced into fld cells and RNA was isolated 5 days post-infection. All mRNAs were analyzed as in (A). * indicates p<0.007. (F) HepG2 cells were cotransfected with expression constructs containing a transcriptionally active, truncated form of SREBP-1 along with a construct containing a SREBP-1-responsive promoter of either the FASN or SCD1 genes tethered to luciferase cDNA and treated with 20 nM rapamycin, 250 nM Torin1, or vehicle for 4 hours. Luciferase measurements for each promoter activity reporter were normalized to those of SREBP-1 transfected, vehicle treated cells. * indicates p<0.001; # indicates p<0.01. (G) HepG2 cells cotransfected as in (F) were additionally transfected with empty vector, wild-type lipin 1 or 17xS/T->A lipin 1. * indicates p<0.0001; # indicates p<0.02.
Figure 5
Figure 5. Constitutively dephosphorylated, nuclear lipin 1 decreases nuclear SREBP protein abundance
(A) NIH3T3 cells were treated with 20 nM rapamycin, 250 nM Torin1, or vehicle for the indicated times, cytoplasmic and nuclear fractions were isolated and the levels of the indicated proteins were analyzed by immunoblotting. (B) NIH3T3 cells were grown in complete media or deprived of serum, serum and glucose, or serum and amino acids for 4 hours and analyzed as in (A). (C) Wild-type or fld MEFs were treated with 250 nM Torin1 or vehicle for the indicated times and analyzed as in (A). (D) Indicated FLAG-tagged lentiviral expression vectors were stably introduced into NIH3T3 cells and analyzed as in (A). (E) NIH3T3 cells overexpressing FLAG-SREBP-1 were treated with 250 nM Torin1 or vehicle for 8 hours. Cells were then processed in an immunofluorescence assay to detect FLAG (red), lamin A (green), and costained with DAPI for DNA content (blue), and imaged. (F) Fld cells coexpressing HA-SREBP-1 and wild-type or 17xS/T->A mutant lipin 1 were processed in an immunofluorescence assay to detect HA (red), lamin A (green), and costained with DAPI for DNA content (blue), and imaged.
Figure 6
Figure 6. Response of liver-specific raptor knock-out (Li-RapKO) mice to a high fat and high cholesterol (western) diet is lipin 1-dependent
(A) Control (floxed raptor; Albumin-CRE−, abbreviated Ctrl) and Li-RapKO (floxed raptor; Albumin-CRE+) were starved of chow overnight and re-fed for 45 minutes. Liver and muscle tissue lysates were prepared and analyzed by immunoblotting for the phosphorylation states and levels of specified proteins. (B) Representative 1x or 20x images of control and Li-RapKO livers taken from chow and western diet-fed mice. (C) Liver tissue was isolated and RNA was extracted from the indicated mice fed their respective diets for 6–8 weeks. All mice were starved for 4 hours prior to liver harvesting. All mRNAs were measured by qRT-PCR and normalized to 36B4 mRNA levels. Error bars indicate standard error for n=4–6. C, Chow, W, Western. * indicates p<0.02, # p<0.04 ^ p<0.05, respectively. (D) Liver tissue from which lipids were extracted and plasma for cholesterol measurements were obtained from mice fed the indicated diets for 6–8 weeks and starved 4 hours prior to sample harvesting. Error bars indicate standard error for n=4 (liver triglycerides), n=6 (plasma cholesterol). * indicates p<0.004, # indicates p<0.05. (E) Western diet-fed control and Li-RapKO were infected with adenovirus expressing shRNAs targeting lacZ or lipin 1. Liver was harvested 5 days after infection and lysates prepared and immunoblotting was performed for the indicated proteins. (F) mRNA was isolated and analyzed as in (C). * indicates p<0.01, # indicates p<0.05 in comparing LacZ shRNA versus lipin 1 shRNA treated Li-RapKO mice. (G) Liver triglycerides and plasma cholesterol were measured as in (D). * indicates p<0.05, # indicates p<0.05.
Figure 7
Figure 7
Model of mTORC1/lipin 1-dependent regulation of SREBP transcriptional activity

References

    1. Abraham RT, Eng CH. Mammalian target of rapamycin as a therapeutic target in oncology. Expert Opin Ther Targets. 2008;12:209–222. - PubMed
    1. Blum CB. Effects of sirolimus on lipids in renal allograft recipients: an analysis using the Framingham risk model. Am J Transplant. 2002;2:551–559. - PubMed
    1. Boguslavsky RL, Stewart CL, Worman HJ. Nuclear lamin A inhibits adipocyte differentiation: implications for Dunnigan-type familial partial lipodystrophy. Hum Mol Genet. 2006;15:653–663. - PubMed
    1. Brown EJ, Albers MW, Shin TB, Ichikawa K, Keith CT, Lane WS, Schreiber SL. A mammalian protein targeted by G1-arresting rapamycin-receptor complex. Nature. 1994;369:756–758. - PubMed
    1. Brown EJ, Beal PA, Keith CT, Chen J, Shin TB, Schreiber SL. Control of p70 s6 kinase by kinase activity of FRAP in vivo. Nature. 1995;377:441–446. - PubMed

Publication types

Substances