. 2012 Jan;29(1):101-11.
doi: 10.1093/molbev/msr151. Epub 2011 Aug 4.

Crohn's disease and genetic hitchhiking at IBD5

Affiliations

Crohn's disease and genetic hitchhiking at IBD5

Chad D Huff et al. Mol Biol Evol. 2012 Jan.

Abstract

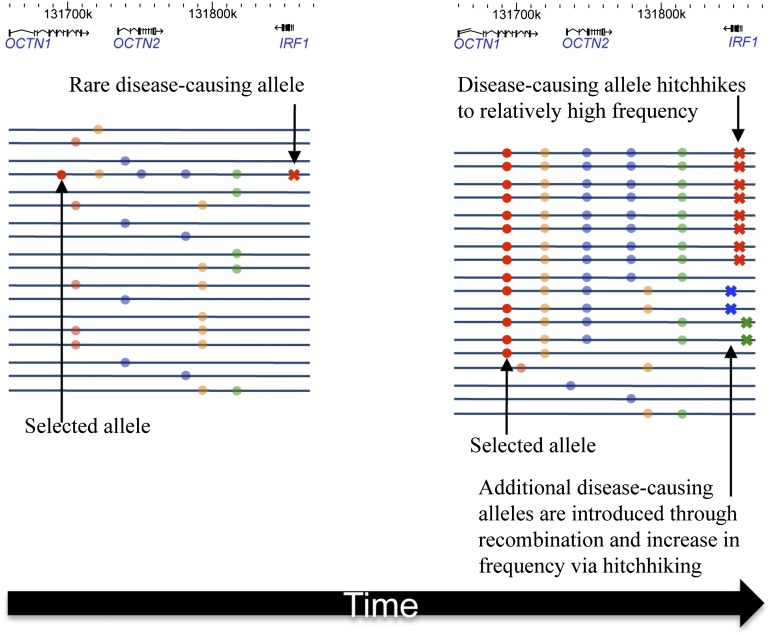
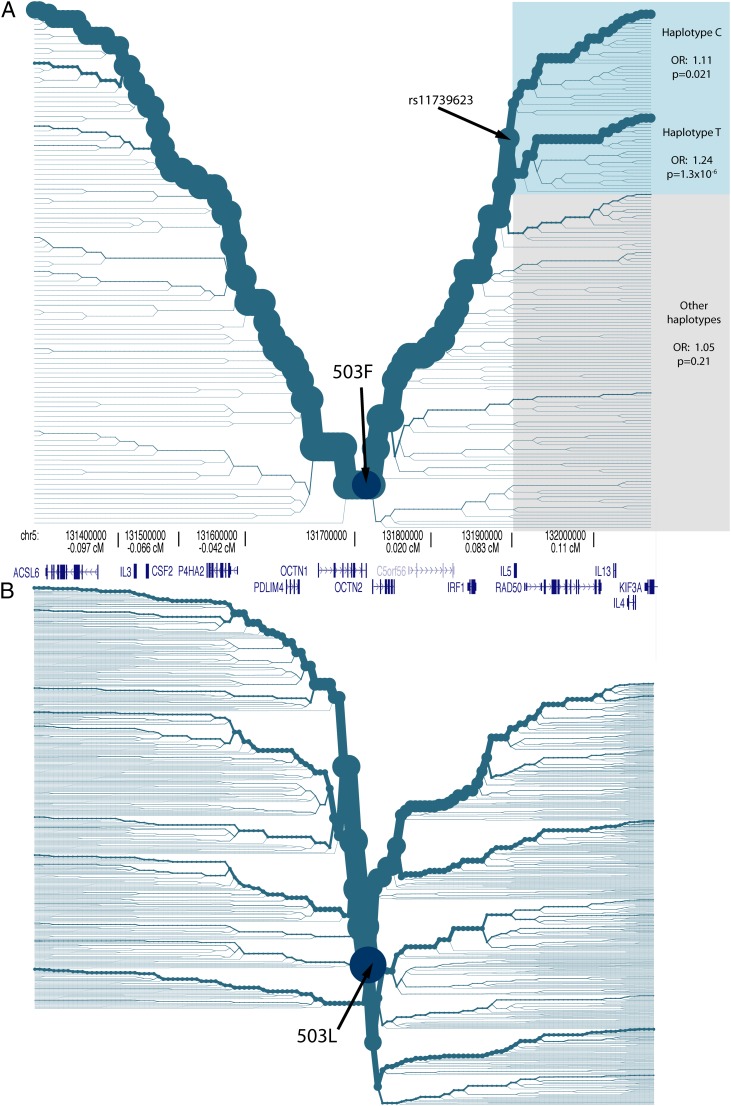
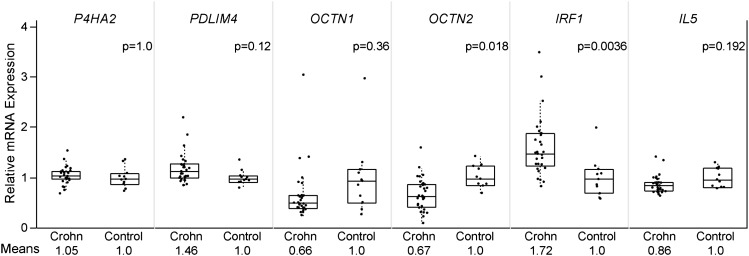
Inflammatory bowel disease 5 (IBD5) is a 250 kb haplotype on chromosome 5 that is associated with an increased risk of Crohn's disease in Europeans. The OCTN1 gene is centrally located on IBD5 and encodes a transporter of the antioxidant ergothioneine (ET). The 503F variant of OCTN1 is strongly associated with IBD5 and is a gain-of-function mutation that increases absorption of ET. Although 503F has been implicated as the variant potentially responsible for Crohn's disease susceptibility at IBD5, there is little evidence beyond statistical association to support its role in disease causation. We hypothesize that 503F is a recent adaptation in Europeans that swept to relatively high frequency and that disease association at IBD5 results not from 503F itself, but from one or more nearby hitchhiking variants, in the genes IRF1 or IL5. To test for evidence of recent positive selection on the 503F allele, we employed the iHS statistic, which was significant in the European CEU HapMap population (P=0.0007) and European Human Genome Diversity Panel populations (P≤0.01). To evaluate the hypothesis of disease-variant hitchhiking, we performed haplotype association tests on high-density microarray data in a sample of 1,868 Crohn's disease cases and 5,550 controls. We found that 503F haplotypes with recombination breakpoints between OCTN1 and IRF1 or IL5 were not associated with disease (odds ratio [OR]: 1.05, P=0.21). In contrast, we observed strong disease association for 503F haplotypes with no recombination between these three genes (OR: 1.24, P=2.6×10(-8)), as expected if the sweeping haplotype harbored one or more disease-causing mutations in IRF1 or IL5. To further evaluate these disease-gene candidates, we obtained expression data from lower gastrointestinal biopsies of healthy individuals and Crohn's disease patients. We observed a 72% increase in gene expression of IRF1 among Crohn's disease patients (P=0.0006) and no significant difference in expression of OCTN1. Collectively, these data indicate that the 503F variant has increased in frequency due to recent positive selection and that disease-causing variants in linkage disequilibrium with 503F have hitchhiked to relatively high frequency, thus forming the IBD5 risk haplotype. Finally, our association results and expression data support IRF1 as a strong candidate for Crohn's disease causation.


Figures

F<sc>IG</sc>. 1.
FIG. 1.
The disease-hitchhiking hypothesis. A new advantageous mutation arises on a chromosome with a rare disease-causing mutation. As the advantageous mutation (red dot) spreads rapidly through the population, the disease-causing mutation (red X) hitchhikes to relatively high frequency, and additional disease-causing mutations (green and blue Xs) are introduced into the sweeping haplotype block by recombination. Neutral and advantageous mutations are shown as dots, and disease-causing mutations are shown as crosses.
F<sc>IG</sc>. 2.
FIG. 2.
Expected increase in frequency of deleterious alleles on the sweeping haplotype after an incomplete selective sweep. Parameter values for the forward-in-time simulations in (A) loosely model the pattern at OCTN1, with a selective advantage of the favorable allele of 0.02, an initial effective population size 10,000, a final allele frequency of the favorable allele of 0.45, and 2,400 potential mutational targets (modeled after the number of nonsynonymous sites in IRF1). (A): The stacked red and green graph represents the expected proportion of haplotypes that contain one or more deleterious alleles among haplotypes with the favorable allele, and the black line indicates the proportion of haplotypes that contain one or more deleterious alleles among haplotypes without the favorable allele. “Most common allele” designates the proportion of haplotypes with the most common deleterious variant, and “All other alleles” indicates the proportion of haplotypes that contain one or more deleterious variants but do not contain the most common variant. Unless otherwise specified, parameter values in panels (BG) are the same as in (A). (BG): The relationship between equilibrium distance and (B) the selection coefficient of the favorable allele in a population of constant size; (C) the selection pressure of the favorable allele in a population that begins expanding at a rate of 0.5% per generation after the introduction of the advantageous allele; (D) the final allele frequency of the favorable allele; (E) the number of mutable sites constrained by purifying selection (equivalent to the mutation rate at the locus); (F) the selection pressure against deleterious alleles; and (G) the effective population size.
F<sc>IG</sc>. 3.
FIG. 3.
Geographic distribution of (A) the age of early Neolithic archaeological sites and (B) the 503F allele of OCTN1. The contour map in (A) is similar to figure 1A in Balaresque et al. (2010) and is based on the dates of 774 archaeological sites provided in Hassan (1985) and Pinhasi et al. (2005). The contour map in (B) is based on the population frequency of 503F in 85 populations across the Old World (supplementary table S2, Supplementary Material online). The intensity surfaces for the contour maps were generated using bicubic spline interpolation (Matlab r2009a griddata, 'v4' option), followed by truncation of values to fit the ranges indicated in the legends (r2009a). In (B), allele frequencies were averaged for populations located within 1°, and values were not interpolated for regions further than 10° from the nearest frequency data point (gray areas). The allele frequency of 503F in a population and the distance of that population to the nearest early Neolithic site are highly correlated (r2 = 0.44, P = 0.0067, t-test of Spearman’s ρ).
F<sc>IG</sc>. 4.
FIG. 4.
Haplotype bifurcation and disease association at (A) 503F and (B) 503L in Europeans. A haplotype bifurcation diagram is a visual display of the breakdown of LD on the core haplotype, with the thickness of the lines corresponding to the number of samples with the indicated haplotype. We constructed haplotype bifurcation diagrams from the phased genotype data of 1,262 controls (see Materials and Methods). Haplotypes C and T indicate the allelic state at rs11739623. “Other haplotypes” indicate the combined group of haplotypes with an inferred recombination event between 503F and rs11739623. The shaded regions in A designate the haplotypes tested for disease association. The structure of genes in this region is shown. The physical positions along chromosome 5 are listed in hg18 coordinates. The genetic distances from L503F (chr5:131704219) are listed in centiMorgan.
F<sc>IG</sc>. 5.
FIG. 5.
Colonic mRNA expression levels for genes within IBD5. Colon biopsy specimens were obtained from Crohn patients (n = 30) and healthy controls (n = 11). mRNA expression was measured using the Affymetrix GeneChip Human Genome HG-U133 Plus 2.0 array. Bonferroni corrected P values are reported from a Wilcoxon rank sum test.

References

    1. Altschul SF, Madden TL, Schaffer AA, Zhang J, Zhang Z, Miller W, Lipman DJ. Gapped BLAST and PSI-BLAST: a new generation of protein database search programs. Nucleic Acids Res. 1997;25:3389–3402. - PMC - PubMed
    1. Badr A, Muller K, Schafer-Pregl R, El Rabey H, Effgen S, Ibrahim HH, Pozzi C, Rohde W, Salamini F. On the origin and domestication history of Barley (Hordeum vulgare) Mol Biol Evol. 2000;17:499–510. - PubMed
    1. Balaresque P, Bowden GR, Adams SM, et al. (16 co-authors) A predominantly neolithic origin for European paternal lineages. PLoS Biol. 2010;8:e1000285. - PMC - PubMed
    1. Bamshad MJ, Watkins WS, Dixon ME, Jorde LB, Rao BB, Naidu JM, Prasad BV, Rasanayagam A, Hammer MF. Female gene flow stratifies Hindu castes. Nature. 1998;395:651–652. - PubMed
    1. Blekhman R, Man O, Herrmann L, Boyko AR, Indap A, Kosiol C, Bustamante CD, Teshima KM, Przeworski M. Natural selection on genes that underlie human disease susceptibility. Curr Biol. 2008;18:883–889. - PMC - PubMed

Publication types