. 2011 Oct;157(Pt 10):2922-2932.
doi: 10.1099/mic.0.050278-0. Epub 2011 Aug 4.

Quantitative RNA-seq analysis of the Campylobacter jejuni transcriptome

Affiliations

Quantitative RNA-seq analysis of the Campylobacter jejuni transcriptome

Roy R Chaudhuri et al. Microbiology (Reading). 2011 Oct.

Abstract

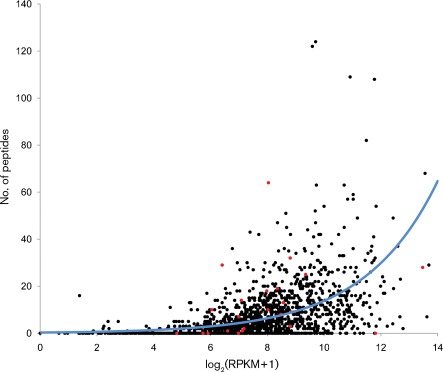
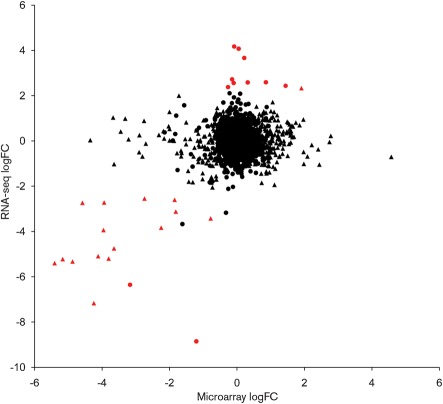
Campylobacter jejuni is the most common bacterial cause of foodborne disease in the developed world. Its general physiology and biochemistry, as well as the mechanisms enabling it to colonize and cause disease in various hosts, are not well understood, and new approaches are required to understand its basic biology. High-throughput sequencing technologies provide unprecedented opportunities for functional genomic research. Recent studies have shown that direct Illumina sequencing of cDNA (RNA-seq) is a useful technique for the quantitative and qualitative examination of transcriptomes. In this study we report RNA-seq analyses of the transcriptomes of C. jejuni (NCTC11168) and its rpoN mutant. This has allowed the identification of hitherto unknown transcriptional units, and further defines the regulon that is dependent on rpoN for expression. The analysis of the NCTC11168 transcriptome was supplemented by additional proteomic analysis using liquid chromatography-MS. The transcriptomic and proteomic datasets represent an important resource for the Campylobacter research community.


Figures

Fig. 1.
Fig. 1.
RNA-seq sequence data mapped to the C. jejuni NCTC11168 genome and visualized using Artemis and Bamview. The top section shows the position of reads derived from the wild-type (red) and reads from the rpoN : : cat mutant (green). The middle section shows a plot of sequence coverage, using the same colour scheme. The lower section shows a representation of the DNA strands and the six possible reading frames, and indicates the positions of annotated features. The highlighted gene, Cj1242, is downregulated in the rpoN mutant. This gene encodes the invasion antigen CiaC (Christensen et al., 2009).
Fig. 2.
Fig. 2.
Density plot showing the distribution of log2(RPKM+1) values obtained for the protein-coding genes in wild-type C. jejuni NCTC11168.
Fig. 3.
Fig. 3.
Artemis plots showing RNA-seq data obtained for pseudogenes (as for Fig. 1). (a) Cj0654c showed an expression pattern typical of most pseudogenes in the genome, with a high level of expression at the 5′ end of the gene that diminishes towards the 3′ end. (b) Cj1064 showed a high level of expression across the length of the pseudogene.
Fig. 4.
Fig. 4.
Consensus secondary structure predictions for the forward (left) and reverse (right) complement intergenic_671549–671895 (a), intergenic_722652–722740 (b), intergenic_906748–907966 (c), intergenic_1127982–1128192 (d) and intergenic_1575021–1575288 (e). The colour markup indicates the sequence conservation.
Fig. 5.
Fig. 5.
Plot of the observed number of peptides from wild-type C. jejuni NCTC11168 against log2(RPKM+1) as a measure of the mRNA expression level. The blue line indicates the predicted protein level according to the fitted log-linear regression with quasi-Poisson errors. Red points indicate mRNAs predicted to encode peptides below the 6 kDa threshold of detection.
Fig. 6.
Fig. 6.
log2(fold change) values obtained using RNA-seq, plotted against the equivalent values from the microarray study (Kamal et al., 2007). Genes showing significant differential expression in the RNA-seq data (P<0.05) are highlighted in red, genes showing significant differential expression in the microarray data (P<0.05) are shown as triangles. (Red triangles, differential expression in the RNA-seq and microarray data; red circles, differential expression in the RNA-seq data; black triangles, differential expression in the microarray data; black circles, no differential expression in either data set.)

References

    1. Altschul S. F., Gish W., Miller W., Myers E. W., Lipman D. J. (1990). Basic local alignment search tool. J Mol Biol 215, 403–410. - PubMed
    1. Anders S., Huber W. (2010). Differential expression analysis for sequence count data. Genome Biol 11, R106. 10.1186/gb-2010-11-10-r106 - DOI - PMC - PubMed
    1. Benjamini Y., Hochberg Y. (1995). Controlling the false discovery rate – a practical and powerful approach to multiple testing. J R Stat Soc B 57, 289–300.
    1. Brosch M., Yu L., Hubbard T., Choudhary J. (2009). Accurate and sensitive peptide identification with Mascot Percolator. J Proteome Res 8, 3176–3181. 10.1021/pr800982s - DOI - PMC - PubMed
    1. Carrillo C. D., Taboada E., Nash J. H., Lanthier P., Kelly J., Lau P. C., Verhulp R., Mykytczuk O., Sy J., et al. & other authors (2004). Genome-wide expression analyses of Campylobacter jejuni NCTC11168 reveals coordinate regulation of motility and virulence by flhA. J Biol Chem 279, 20327–20338. 10.1074/jbc.M401134200 - DOI - PubMed

Publication types

MeSH terms