. 2011 Oct;22(10):1876-86.
doi: 10.1681/ASN.2010080881. Epub 2011 Aug 4.

CXCL16 recruits bone marrow-derived fibroblast precursors in renal fibrosis

Affiliations

CXCL16 recruits bone marrow-derived fibroblast precursors in renal fibrosis

Gang Chen et al. J Am Soc Nephrol. 2011 Oct.

Abstract

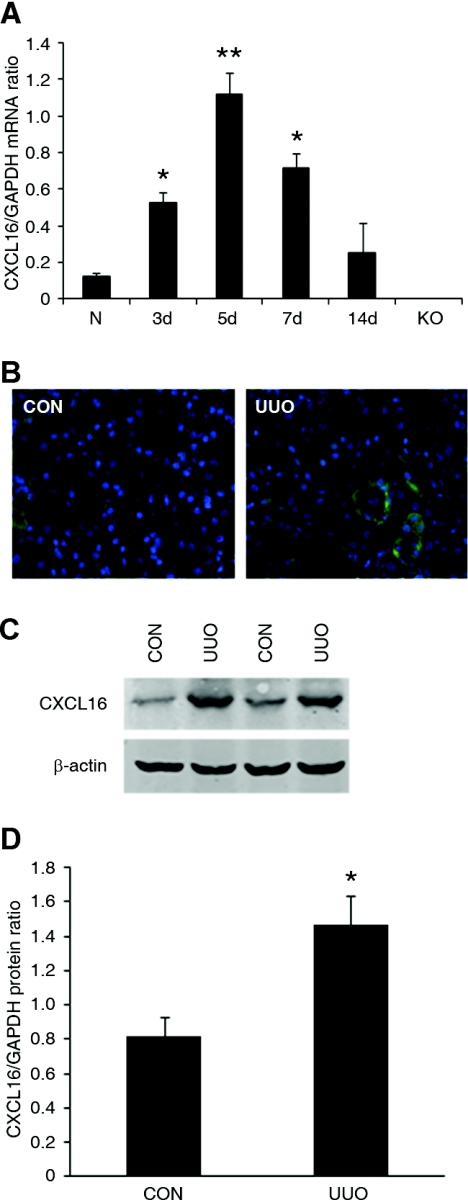
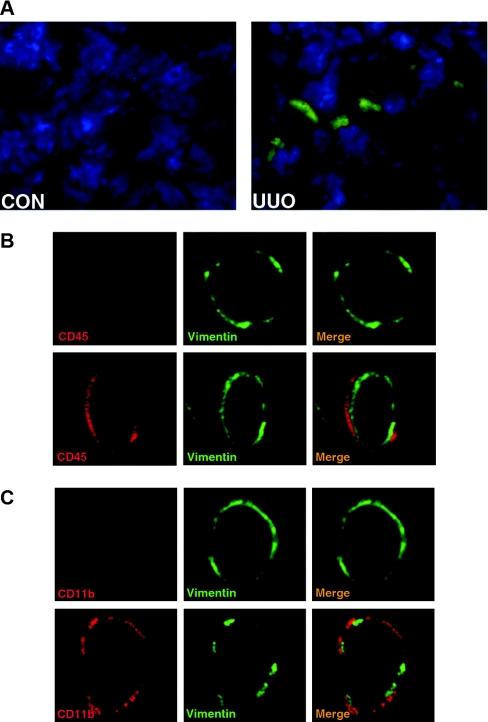
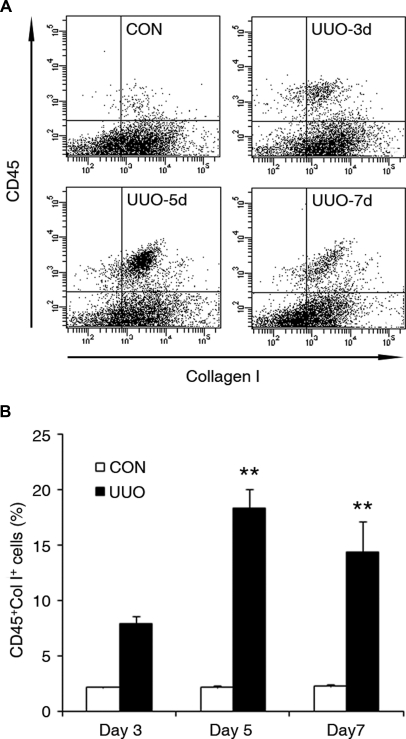
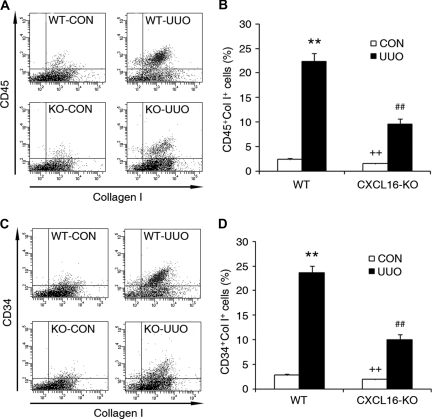
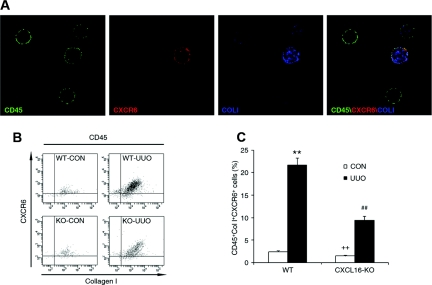
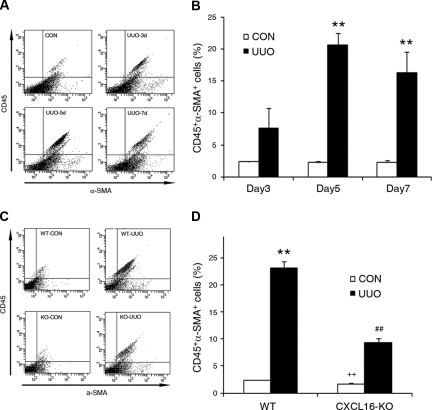
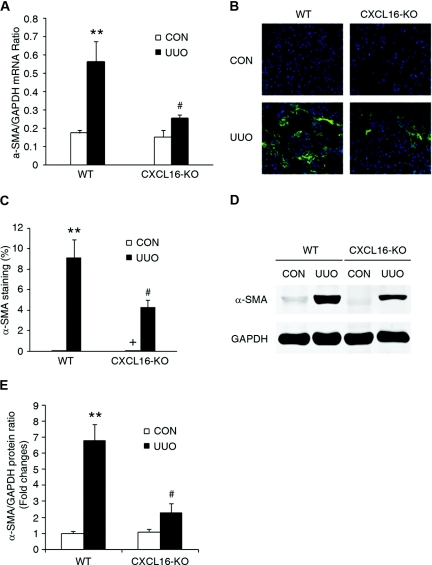
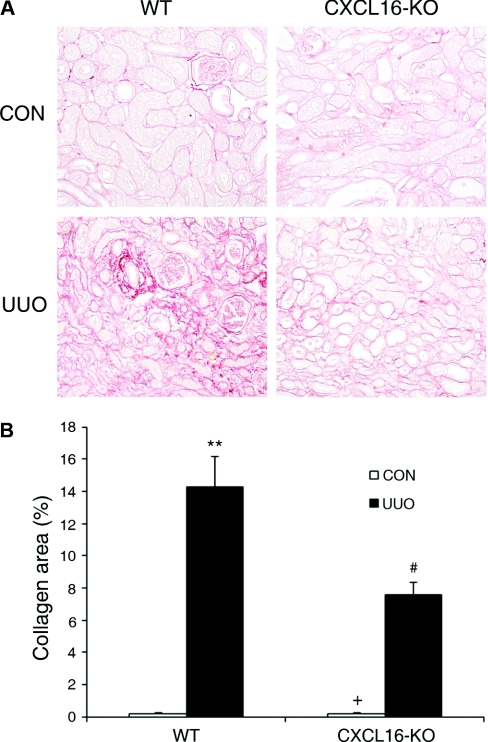
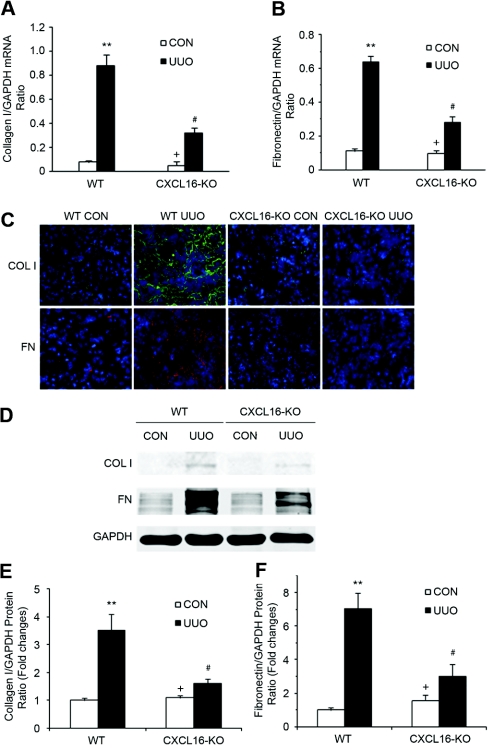
Although fibroblasts are responsible for the production and deposition of extracellular matrix in renal fibrosis, their origin is controversial. Circulating fibroblast precursors may contribute to the pathogenesis of renal fibrosis, but the signaling mechanisms underlying the recruitment of bone marrow-derived fibroblast precursors into the kidney in response to injury are incompletely understood. Here, in the unilateral ureteral obstruction model of renal fibrosis, tubular epithelial cells upregulated the chemokine CXCL16 in obstructed kidneys, and circulating fibroblast precursors expressed the CXCL16 receptor, CXCR6. Compared with wild-type mice, CXCL16-knockout mice accumulated significantly fewer bone marrow-derived fibroblast precursors in obstructed kidneys. CXCL16-knockout mice also exhibited significantly fewer CD45-, collagen I-, and CXCR6-triple-positive fibroblast precursors in injured kidneys. Furthermore, targeted deletion of CXCL16 inhibited myofibroblast activation, reduced collagen deposition, and suppressed expression of collagen I and fibronectin. In conclusion, CXCL16 contributes to the pathogenesis of renal fibrosis by recruiting bone marrow-derived fibroblast precursors.


Figures

Figure 1.
Figure 1.
The expression of CXCL16 is induced in the kidney after obstructive injury. (A) Graphic presentation shows the time course of CXCL16 mRNA induction. N indicates normal kidney and KO indicates kidney of CXCL16-KO mice. *P < 0.05 and **P < 0.01 versus normal control kidney. n = 3 to 4. (B) Representative photomicrographs of kidney sections stained for CXCL16 (green) and DAPI (blue) (original magnification, ×400). (C) Representative Western blots show the protein levels of CXCL16 in control kidney and UUO kidney of WT mice. (D) Quantitative analysis of CXCL16 protein expression in the control kidney and UUO kidney of WT mice. *P < 0.05 versus WT controls. n = 4.
Figure 2.
Figure 2.
Bone marrow-derived fibroblast precursors accumulate in the kidney in response to obstructive injury. (A) Representative photomicrographs show GFP-positive cells in the kidney in response to obstructive injury. Cryosections of the kidneys were fixed and stained with DAPI and examined with a fluorescence microscope. GFP, green; DAPI, blue. (B) Representative photomicrographs show that CD45- and vimentin-positive fibroblast precursors are present in the kidney in response to obstructive injury. Frozen kidney sections were stained for CD45 (red) and vimentin (green) and were examined with a confocal microscope (original magnification, ×1000). Upper panel shows representative photomicrographs of CD45 and vimentin staining of the control kidney. Lower panel shows representative photomicrographs of CD45 and vimentin staining of the obstructed kidney. CD45 and vimentin dual-positive fibroblast precursors are observed only in the kidney with obstructive injury. (C) Representative photomicrographs show that CD11b- and vimentin-positive fibroblast precursors are present in the kidney in response to obstructive injury. Frozen kidney sections were stained for CD11b (red) and collagen I (green) and were examined with a confocal microscope (original magnification, ×1000). Upper panel shows representative photomicrographs of CD11b and vimentin staining of the control kidney. Lower panel shows representative photomicrographs of CD11b and vimentin staining of the obstructed kidney. CD11b and vimentin dual-positive fibroblast precursors are observed only in the kidney with obstructive injury.
Figure 3.
Figure 3.
Bone marrow-derived fibroblast precursor accumulates in obstructed kidneys in a time-dependent manner. (A) Representative cytometric diagrams showing CD45- and collagen-I-positive fibroblast precursors in the kidney of WT mice with or without UUO for 3, 5, or 7 days. Freshly isolated renal cells were stained with CD45 and collagen I and analyzed with flow cytometry. (B) Quantitative analysis of CD45 and collagen I dual-positive fibroblast precursors in the kidney of WT mice with or without UUO for 3, 5, or 7 days as determined by flow cytometry. **P < 0.01. n = 3 per group.
Figure 4.
Figure 4.
Targeted disruption of CXCL16 inhibits the accumulation of bone marrow-derived fibroblast precursors in obstructed kidneys. (A) Representative cytometric diagrams showing the effect of CXCL16 deficiency on the accumulation of CD45 and collagen I dual-positive fibroblast precursors in the kidney in response to UUO. (B) Quantitative analysis of CD45 and collagen I dual-positive fibroblast precursors in the kidney in response to UUO. **P < 0.01 versus WT control, ++P < 0.01 versus KO UUO, and ##P < 0.01 versus WT UUO. n = 4 per group. (C) Representative cytometric diagrams showing the effect of CXCL16 deficiency on the accumulation of CD34 and collagen I dual-positive fibroblast precursors in the kidney in response to UUO. (D) Quantitative analysis of CD34 and collagen I dual-positive fibroblast precursors in the kidney in response to UUO. **P < 0.01 versus WT control, ++P < 0.01 versus KO UUO, and ##P < 0.01 versus WT UUO. n = 4 per group.
Figure 5.
Figure 5.
Bone marrow-derived fibroblast precursors express functional CXCR6. (A) Bone marrow-derived fibroblast precursors express CXCR6. Peripheral blood cells were stained for CD45 (green), CXCR6 (red), and collagen I (blue) and identified by a deconvolution fluorescence microscope (original magnification, ×600). CD45, CXCR6, and collagen I triple-positive fibroblast precursors were detected in the circulation. (B) Representative cytometric diagrams showing the CXCR6- and collagen-I-positive cell distribution of all CD45-positive cells. Freshly isolated cells from the whole kidney of WT and CXCL16-KO mice with or without UUO for 5 days were stained with FITC-conjugated anti-CD45 antibody, PE-conjugated anti-CXCR6 antibody, and biotin-conjugated anti-collagen I antibody followed by APC-conjugated streptavidin; fluorescence intensities were measured by flow cytometry. (C) Quantitative analysis of CD45-, CXCR6-, and collagen-I-positive fibroblast precursors in the kidney of WT and CXCL16-KO mice with or without UUO as determined by flow cytometry. **P < 0.01 versus WT control, ++P < 0.01 versus KO UUO, and ##P < 0.01 versus WT UUO. n = 4 per group.
Figure 6.
Figure 6.
CD45 and α-SMA dual-positive myofibroblasts accumulate in the injured kidney in a time- and CXCL16-dependent manner. (A) Representative cytometric diagrams showing CD45- and α-SMA-positive cells in the kidneys of WT mice with or without UUO at day 3, 5, and 7. Freshly isolated cells from the whole kidney of WT mice with or without UUO for 3, 5, or 7 days were stained with FITC-conjugated anti-CD45 antibody and PE-conjugated anti-α-SMA antibody; fluorescence intensities were measured by flow cytometry. (B) Quantitative analysis of CD45- and α-SMA-positive cells in the kidney of WT mice with or without UUO at day 3, 5, and 7 as determined by flow cytometry. **P < 0.01. n = 3 per group. (C) Representative cytometric diagrams showing CD45- and α-SMA-positive cell distribution in the kidney of WT and CXCL16-KO mice with or without UUO. Freshly isolated cells from whole kidney of WT and CXCL16-KO mice with or without UUO for 5 days were stained with FITC-conjugated anti-CD45 antibody and PE-conjugated anti-α-SMA antibody; fluorescence intensities were measured by flow cytometry. (D) Quantitative analysis of CD45- and α-SMA-positive cells in the kidney of WT and CXCL16-KO mice with or without UUO as determined by flow cytometry. **P < 0.01 versus WT control, ++P < 0.01 versus KO UUO, and ##P < 0.01 versus WT UUO. n = 4 per group.
Figure 7.
Figure 7.
Targeted disruption of CXCL16 reduces α-SMA expression in obstructive nephropathy. (A) The mRNA levels of α-SMA in the kidney of WT and CXCL16-KO mice in response to injury as determined by real-time RT-PCR. **P < 0.01 versus WT controls and #P < 0.05 versus WT UUO. n = 3 to 4 per group. (B) Representative photomicrographs of α-SMA immunostaining in the kidney of WT and CXCL16-KO mice at day 7 after surgery. (C) Quantitative measurements of α-SMA protein expression in the kidney of WT and CXCL16-KO mice. **P < 0.01 versus WT controls and #P < 0.05 versus WT UUO. n = 5 to 6 per group. (D) Representative Western blots show the levels of α-SMA protein expression in the kidney of WT and CXCL16-KO mice. (E) Quantitative analysis of α-SMA protein expression in the kidney of WT and CXCL16-KO mice. **P < 0.01 versus WT controls and #P < 0.05 versus WT UUO. n = 3 per group.
Figure 8.
Figure 8.
Targeted disruption of CXCL16 attenuates renal fibrosis and ECM deposition. (A) Representative photomicrographs show kidney sections stained with picrosirius red for assessment of total collagen deposition (original magnification, ×200). (B) Quantitative analysis of renal interstitial collagen in different groups as indicated. **P < 0.01 versus WT controls, +P < 0.05 versus KO UUO, and #P < 0.05 versus WT UUO. n = 5 to 6 per group.
Figure 9.
Figure 9.
Targeted disruption of CXCL16 inhibits collagen I and fibronectin expression in the obstructed kidney. (A) The mRNA levels of collagen I in the kidney of WT and CXCL16-KO mice in response to injury as determined by real-time RT-PCR. **P < 0.01 versus WT controls, +P < 0.05 versus KO UUO, and #P < 0.05 versus WT UUO. n = 3 to 4 per group. (B) The mRNA levels of fibronectin in the kidney of WT and CXCL16-KO mice in response to injury as determined by real-time RT-PCR. **P < 0.01 versus WT controls, +P < 0.05 versus KO UUO, and #P < 0.05 versus WT UUO. n = 3 to 4 per group. (C) Representative photomicrographs of collagen I and fibronectin immunostaining in the kidney of WT and CXCL16-KO mice at day 14 after surgery (original magnification, ×400). (D) Representative Western blots show the protein levels of collagen I and fibronectin in the kidney of WT and CXCL16-KO mice. (E) Quantitative analysis of collagen I protein expression in the kidney of WT and CXCL16-KO mice. **P < 0.01 versus WT controls, +P < 0.05 versus KO UUO, and #P < 0.05 versus WT UUO. n = 3 per group. (F) Quantitative analysis of fibronectin protein expression in the kidney of WT and CXCL16-KO mice. **P < 0.01 versus WT controls, +P < 0.05 versus KO UUO, and #P < 0.05 versus WT UUO. n = 3 per group.

References

    1. Schainuck LI, Striker GE, Cutler RE, Benditt EP: Structural-functional correlations in renal disease. II. The correlations. Hum Pathol 1: 631–641, 1970 - PubMed
    1. Nath KA: The tubulointerstitium in progressive renal disease. Kidney Int 54: 992–994, 1998 - PubMed
    1. Eddy AA: Molecular basis of renal fibrosis. Pediatr Nephrol 15: 290–301, 2000 - PubMed
    1. Neilson EG: Mechanisms of disease: Fibroblasts—A new look at an old problem. Nat Clin Pract Nephrol 2: 101–108, 2006 - PubMed
    1. Strutz F, Muller GA: Renal fibrosis and the origin of the renal fibroblast. Nephrol Dial Transplant 21: 3368–3370, 2006 - PubMed

Publication types