. 2011 Aug 5;333(6043):724-9.
doi: 10.1126/science.1205216.

Chemical genomic profiling for antimalarial therapies, response signatures, and molecular targets

Affiliations

Chemical genomic profiling for antimalarial therapies, response signatures, and molecular targets

Jing Yuan et al. Science. .

Abstract

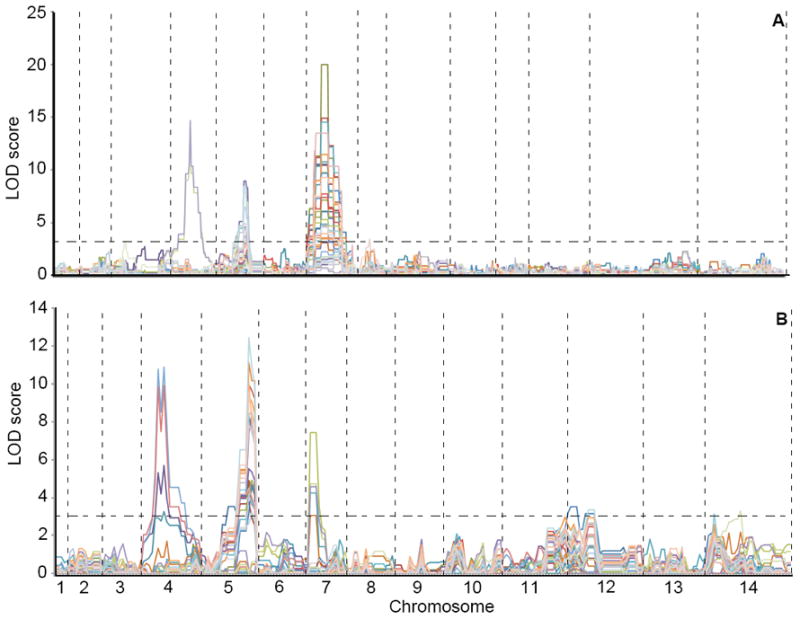
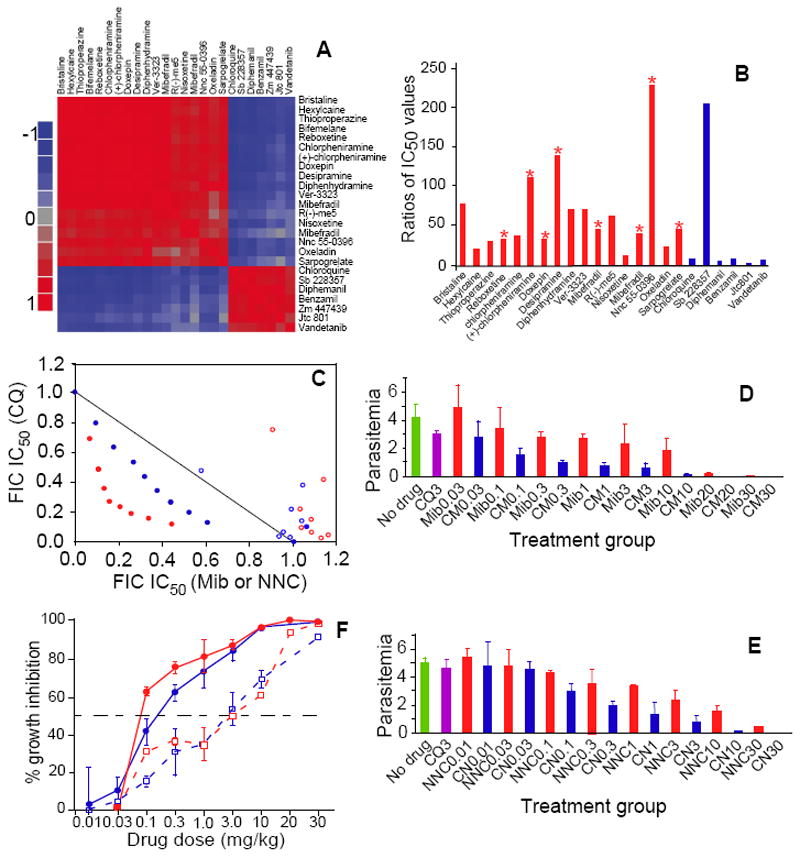
Malaria remains a devastating disease largely because of widespread drug resistance. New drugs and a better understanding of the mechanisms of drug action and resistance are essential for fulfilling the promise of eradicating malaria. Using high-throughput chemical screening and genome-wide association analysis, we identified 32 highly active compounds and genetic loci associated with differential chemical phenotypes (DCPs), defined as greater than or equal to fivefold differences in half-maximum inhibitor concentration (IC(50)) between parasite lines. Chromosomal loci associated with 49 DCPs were confirmed by linkage analysis and tests of genetically modified parasites, including three genes that were linked to 96% of the DCPs. Drugs whose responses mapped to wild-type or mutant pfcrt alleles were tested in combination in vitro and in vivo, which yielded promising new leads for antimalarial treatments.


Conflict of interest statement

Competing Interest: The authors declare that they do not have any competing financial interests.

Figures

Fig. 1
Fig. 1. Clusters of chemical response patterns and major compounds in the components separating parasite populations
A, Plot of chemical clusters with common response signatures and the number of Plasmodium falciparum lines; B, clustering of parasites based on patterns of parasite responses (IC50 values). Cam1, parasites from Cambodia; SA, South America; AF/Thai/CA, Africa, Thailand, and Central America; Thai/Cam2, Thailand and Cambodia; * indicates two parasites from Africa. C, principal component analysis (PCA) of parasite response patterns showing separation of parasite continental populations; D, correlation plot of the top compounds (eigenvector values <−0.14 or >0.14) positively and negatively contributing to PCA component 2 separating American population from Asian and African populations. E, correlation plot of the top compounds (eigenvector values <−0.14 or >0.14) positively and negatively contributing to PCA component 5 separating African and Southeast Asian populations. For the full names of the compounds, please see Table S6.
Fig. 2
Fig. 2. Genetic loci linked to differential chemical phenotypes determined using progeny from two genetic crosses
A, plots of quantitative trait loci from compounds with a LOD score >3.0 in the Dd2×HB3 cross; B, plot of quantitative trait loci from compounds with a LOD score >3.0 in the 7G8×GB4 cross.
Fig. 3
Fig. 3. Correlated responses among the progeny of the Dd2×HB3 cross and changes in parasite sensitivity against compounds mapped to pfcrt in the presence of low-dose chloroquine in vitro and in vivo
For all sub-figures, CQ, chlorquine; Mib, mibefradil; NNC, NNC55-0396. A, positive and negative correlations of compounds mapped to pfcrt; the color bar indicates correlation coefficient values from 1(100% positive correlation, red) to −1 (100% negative correlation, blue). B, Ratios of IC50 values from drug treatments with or without IC15 level of CQ for the Dd2 line. Red and blue bars indicate ratios for compounds whose responses are negatively and positively correlated with CQ, respectively. * compounds with IC50<100 nM in the presence of IC15 levels of CQ. C, Isobolograms showing synergistic interactions of CQ with NNC (blue dots) or Mib (red dots) in the CQ-resistant Dd2, but slightly antagonistic in the CQ-sensitive HB3 parasite (red circles, Mib; blue circles, NNC); FIC IC50, fractional inhibitory concentration. Shown are representative plots of two independent experiments for each combination. D and E, Mean parasitemia and standard deviations from groups of 3-6 mice treated with various doses of Mib (D) or NNC (E) in the presence (blue bars) or absence (red bars) of 3 mg/kg CQ. CQ3, 3 mg/kg CQ. The numbers after Mib (NNC) are Mib (NNC) doses in mg/kg, and the numbers after CM (CN) are Mib (NNC) doses plus 3 mg/kg CQ. F, Plots of mean growth inhibition with standard errors from D and E to estimate IC50 values; blue lines, NNC; red lines, Mib; dash lines, without CQ; solid lines, with 3 mg/kg CQ.

Comment in

References

    1. White NJ. Science. 2008;320:330. - PubMed
    1. White NJ, Olliaro PL. Parasitol Today. 1996;12:399. - PubMed
    1. Noedl H, et al. N Engl J Med. 2008;359:2619. - PubMed
    1. Bonnet M, et al. Malar J. 2009;8:192. - PMC - PubMed
    1. Dondorp AM, et al. N Engl J Med. 2009;361:455. - PMC - PubMed

Publication types

MeSH terms

Substances