

Sequence effects in the melting and renaturation of short DNA oligonucleotides: structure and mechanistic pathways
- PMID: 21817250
- PMCID: PMC3886633
- DOI: 10.1088/0953-8984/21/3/034105
Sequence effects in the melting and renaturation of short DNA oligonucleotides: structure and mechanistic pathways
Abstract
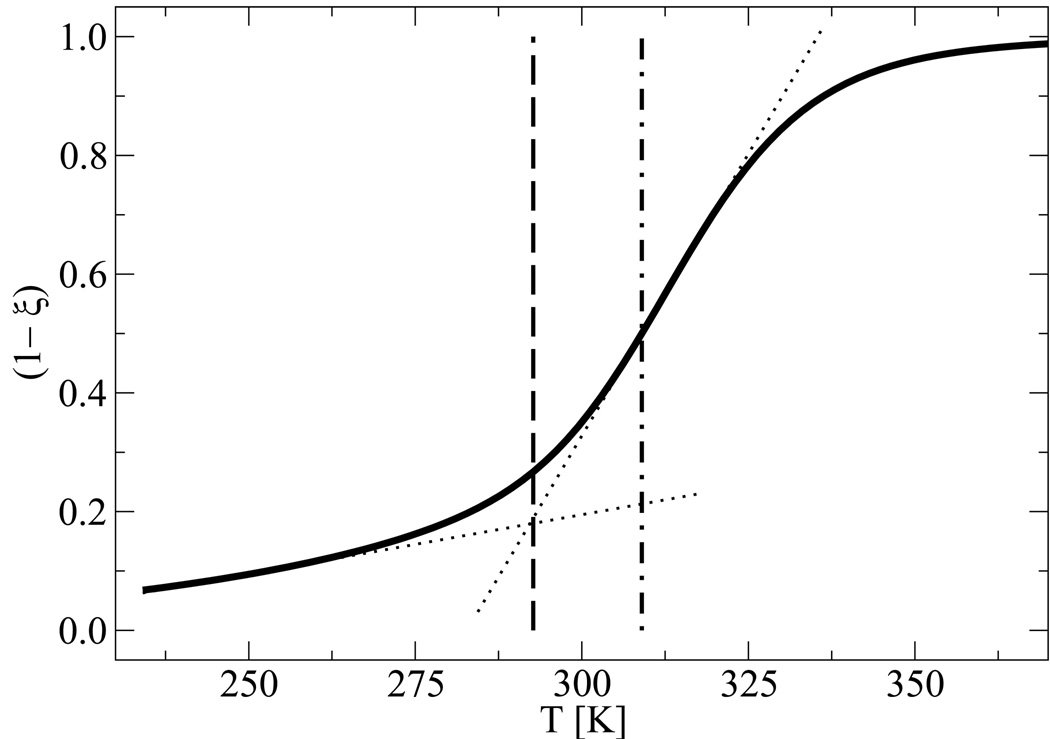
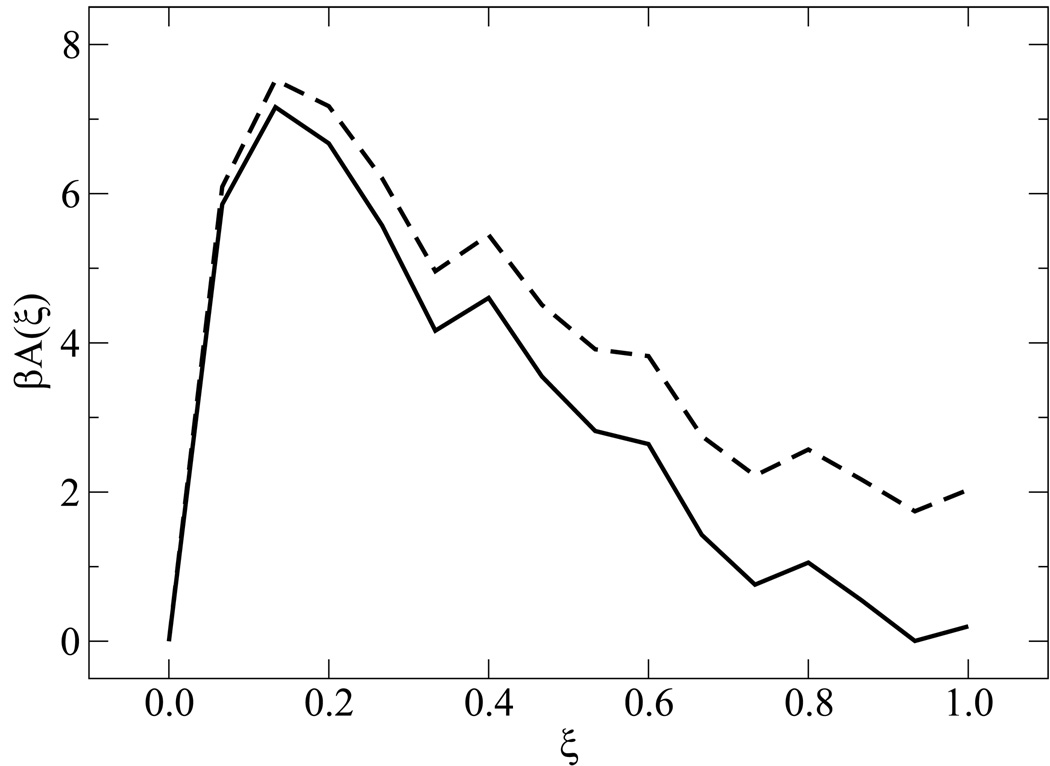
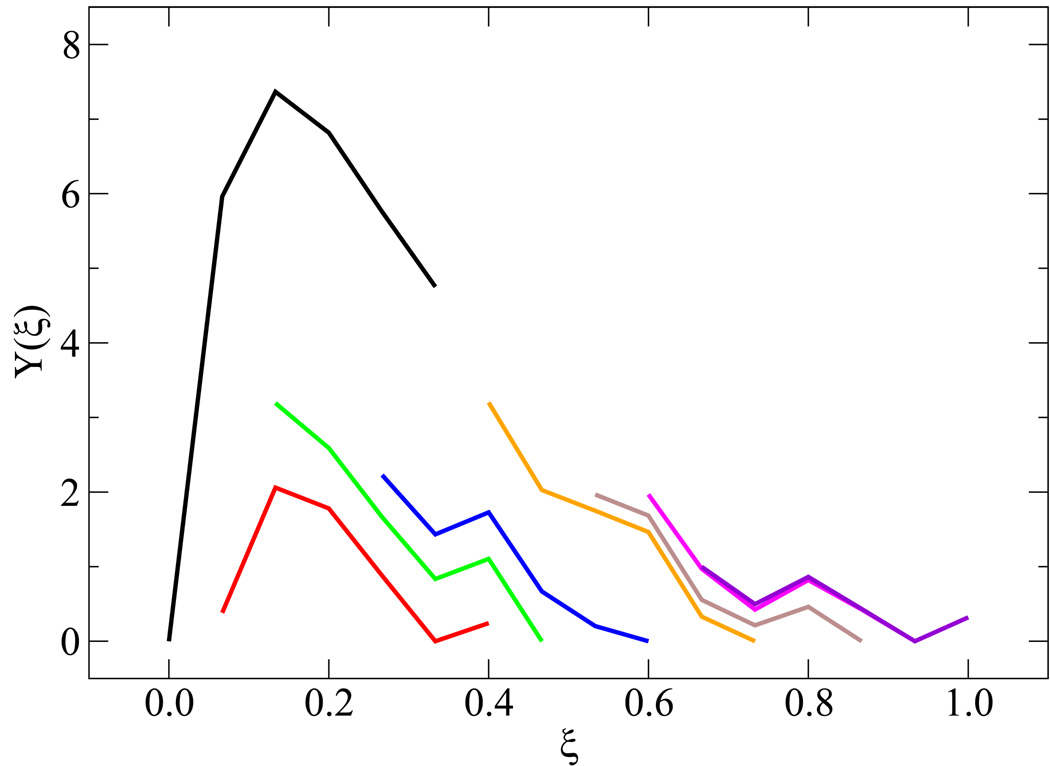
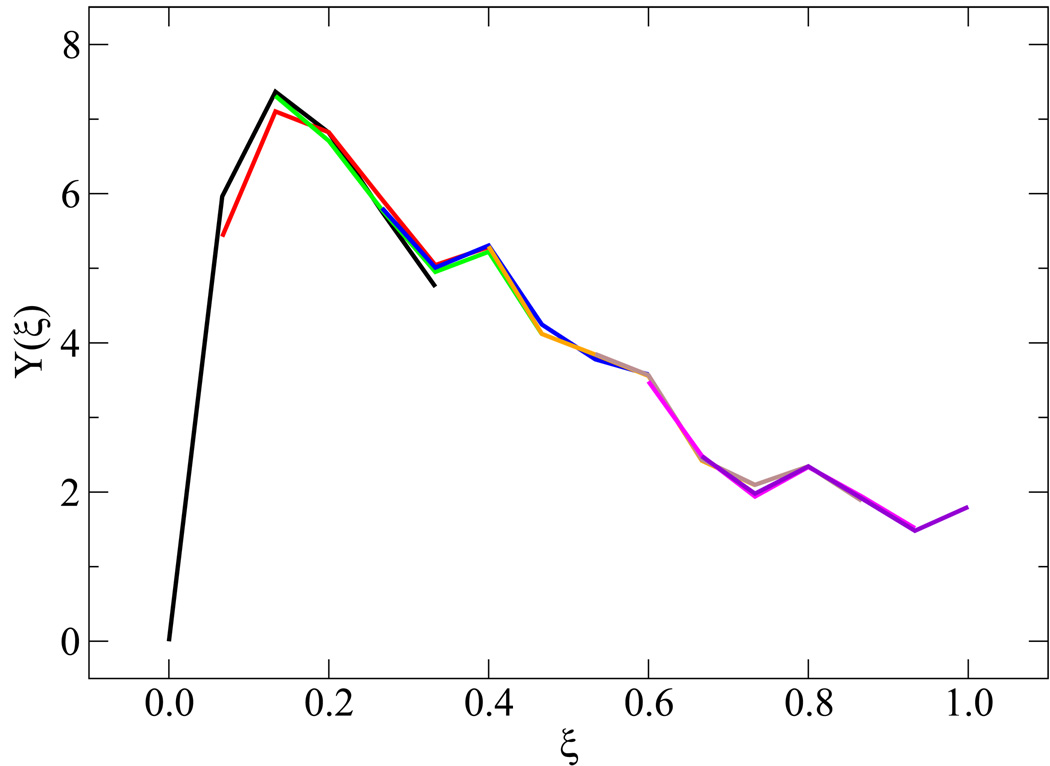
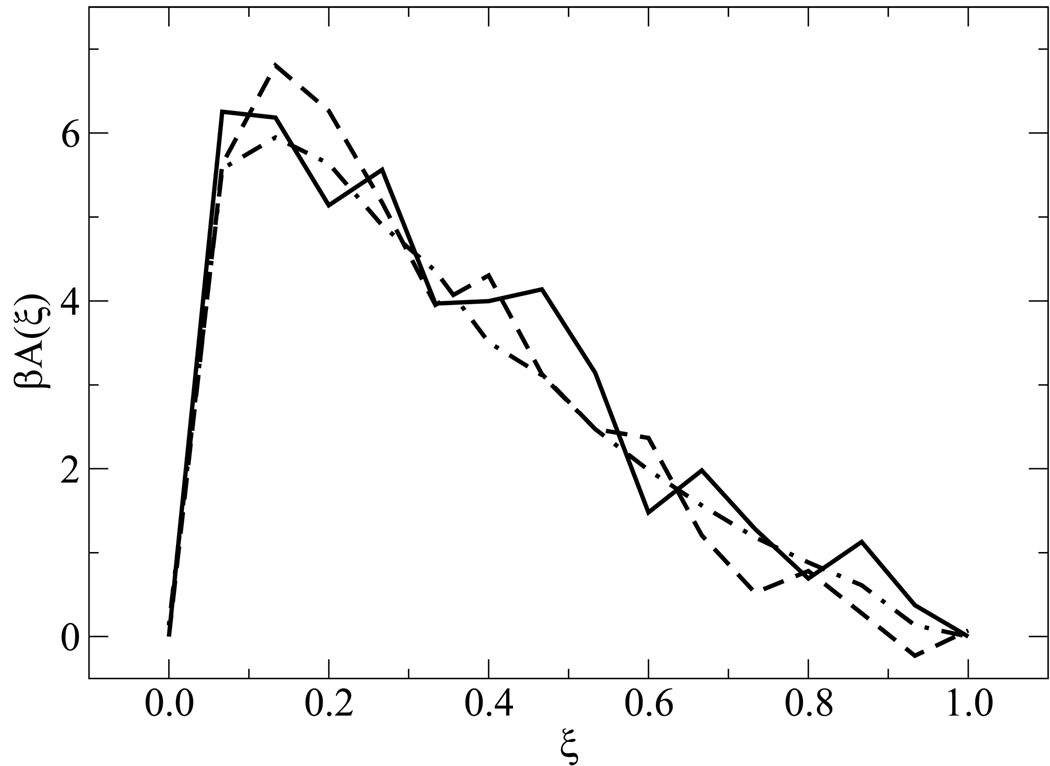
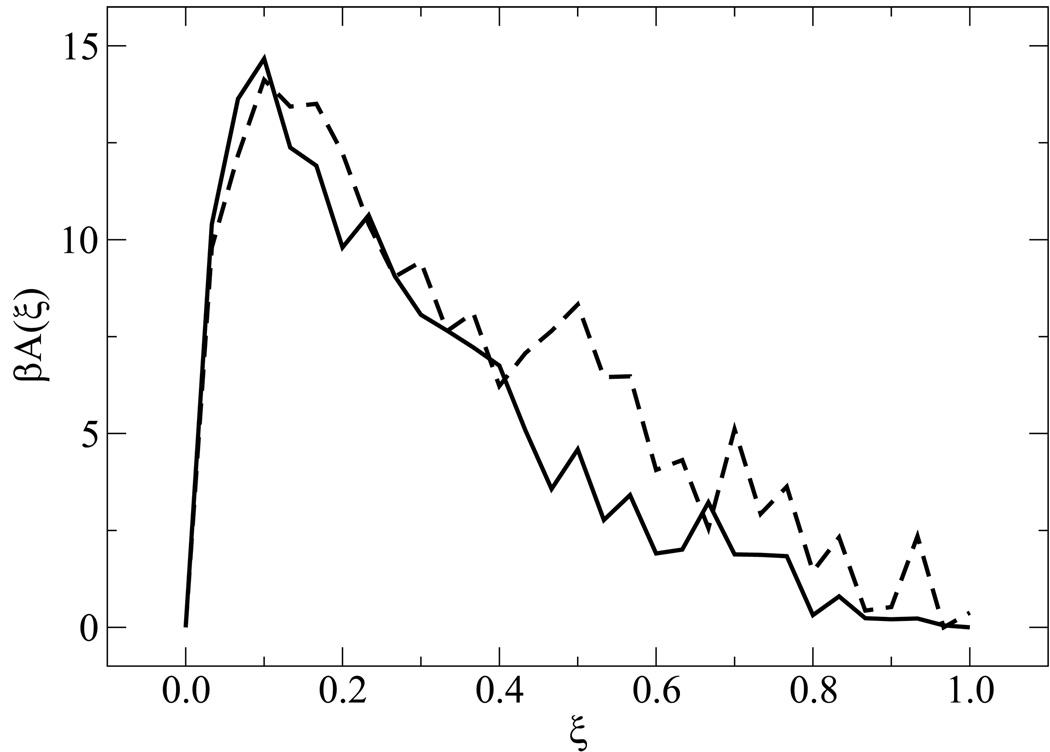
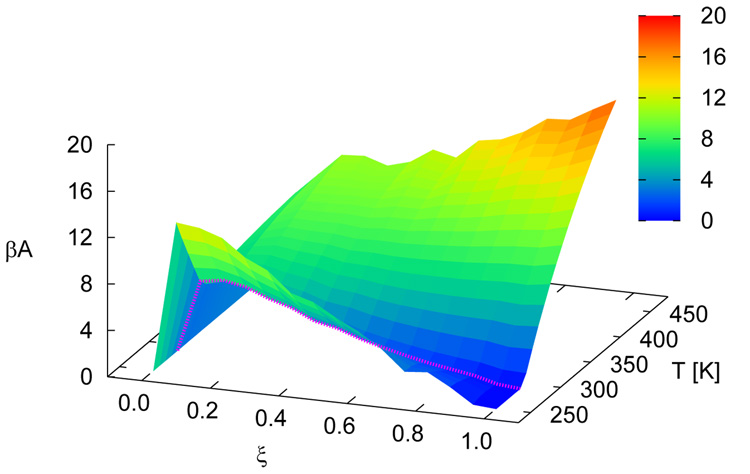
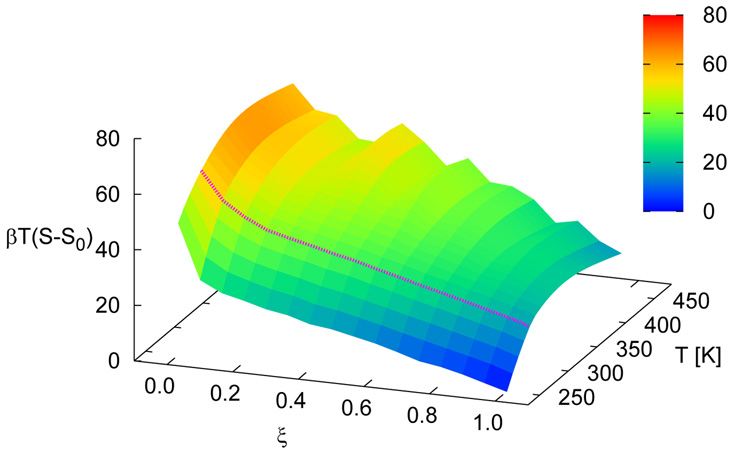
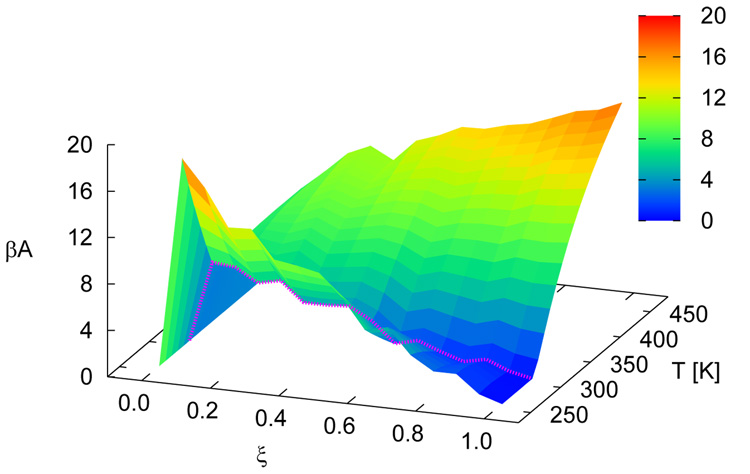
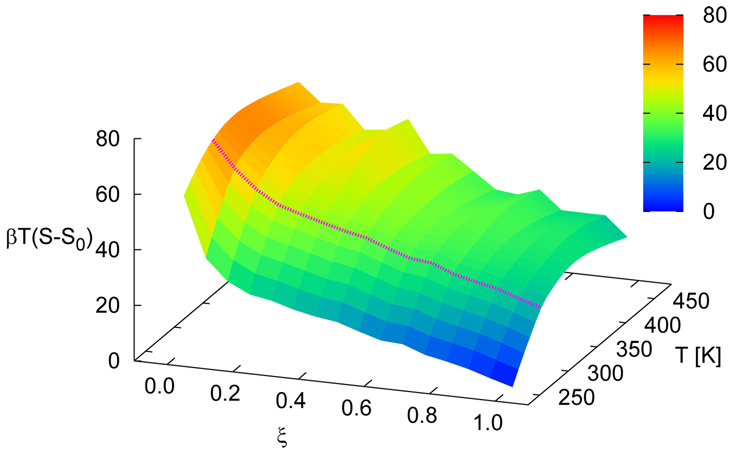
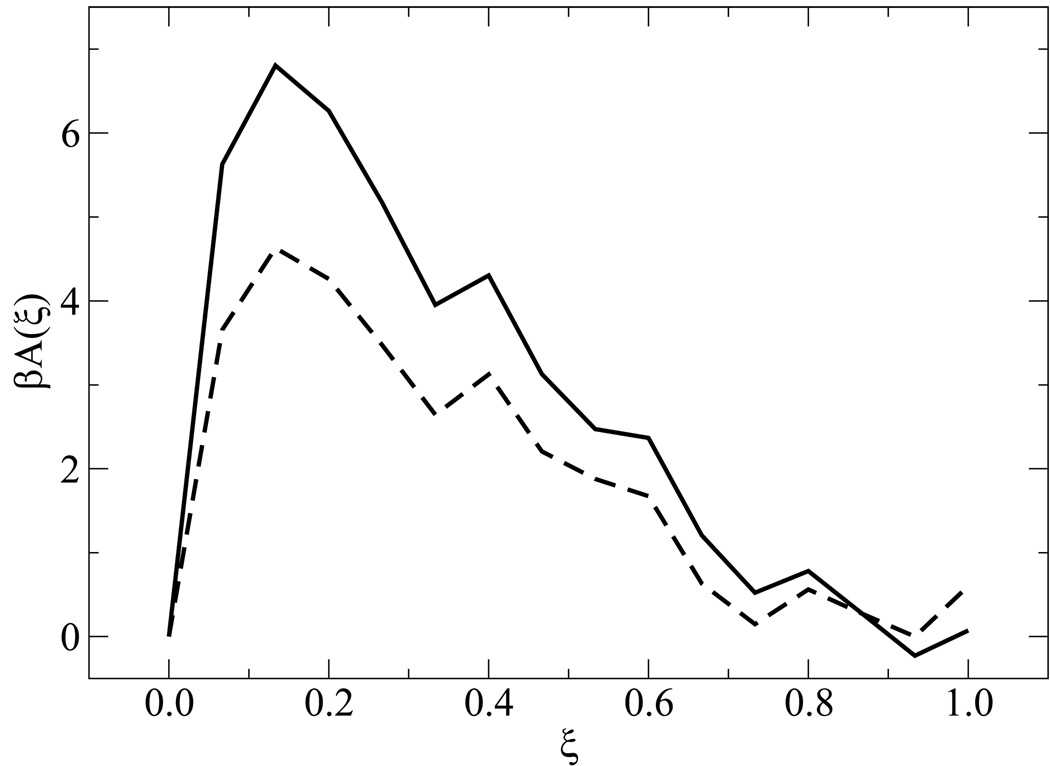
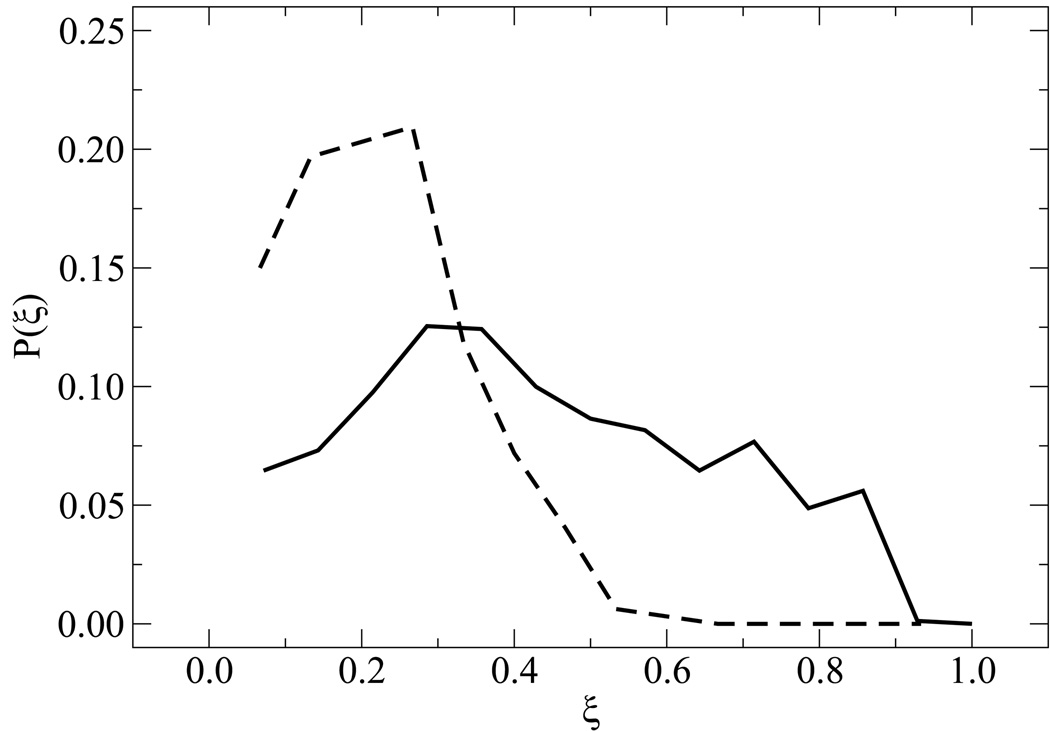
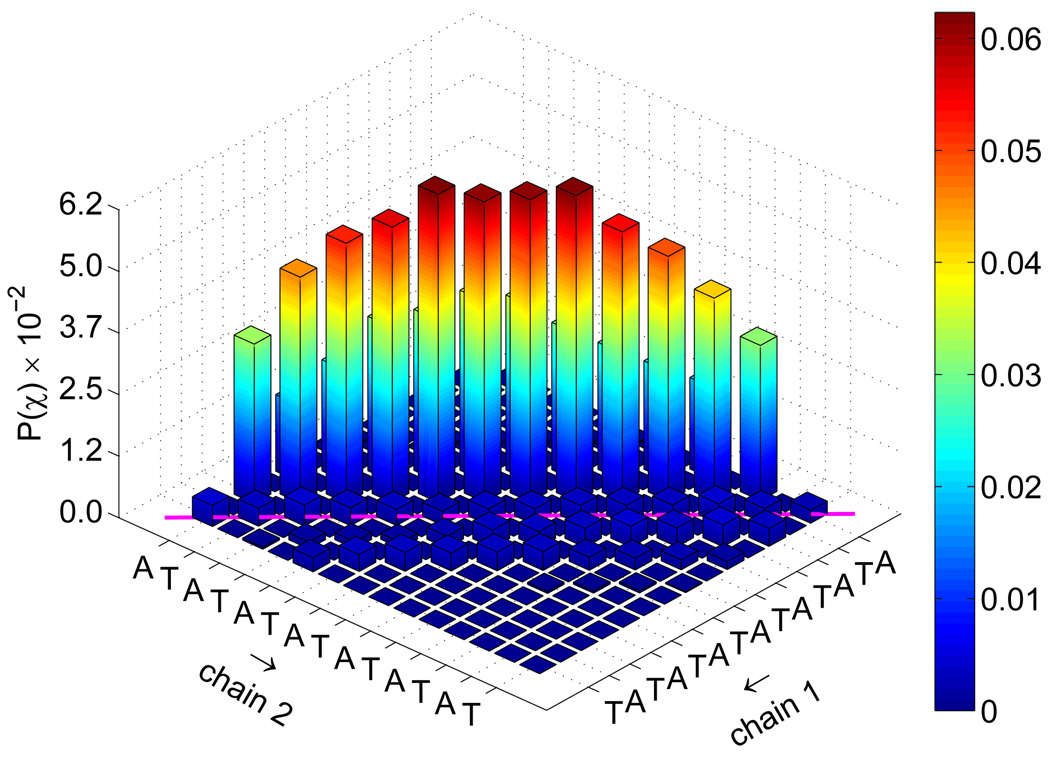
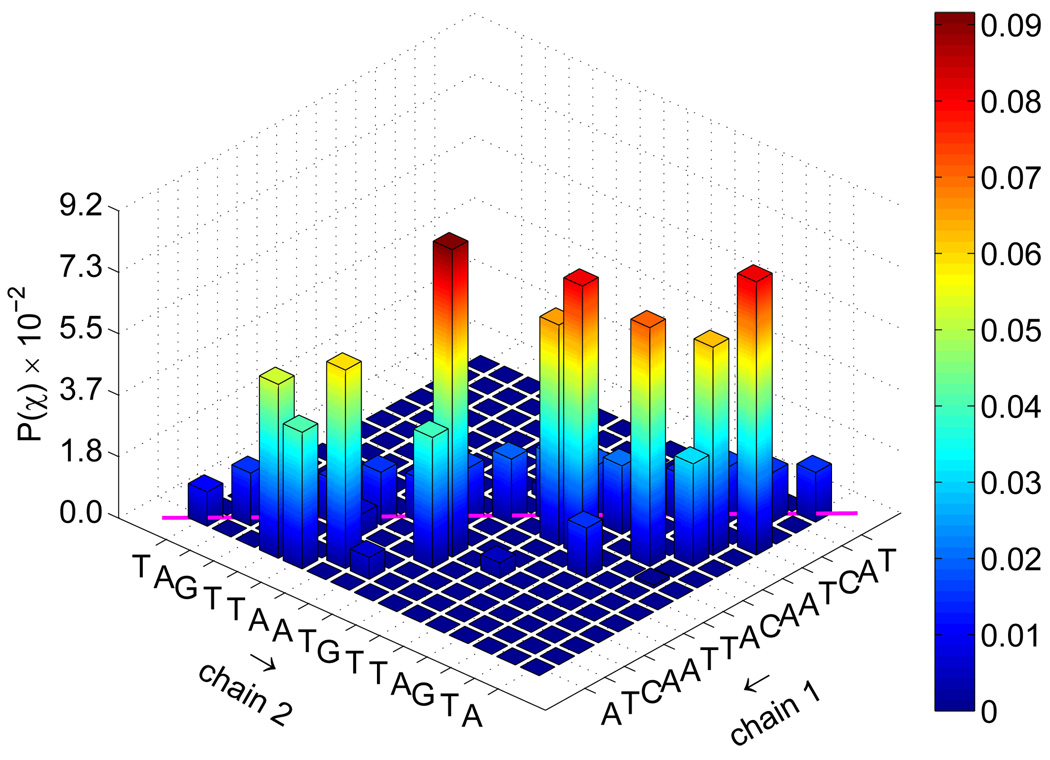
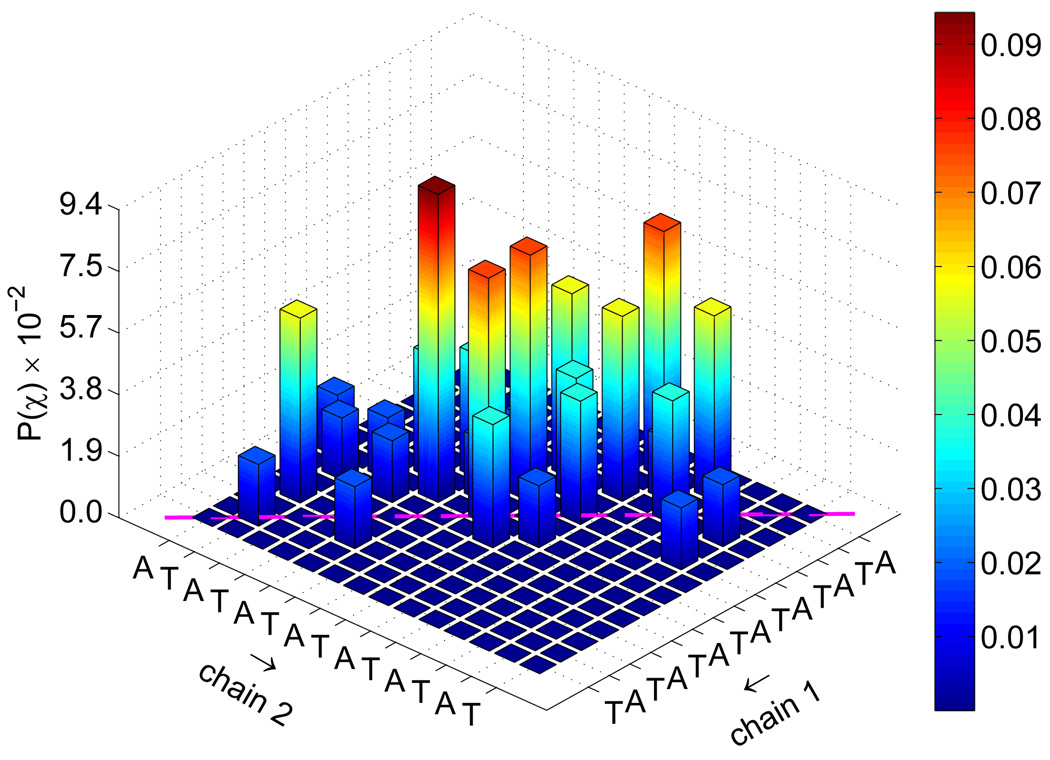
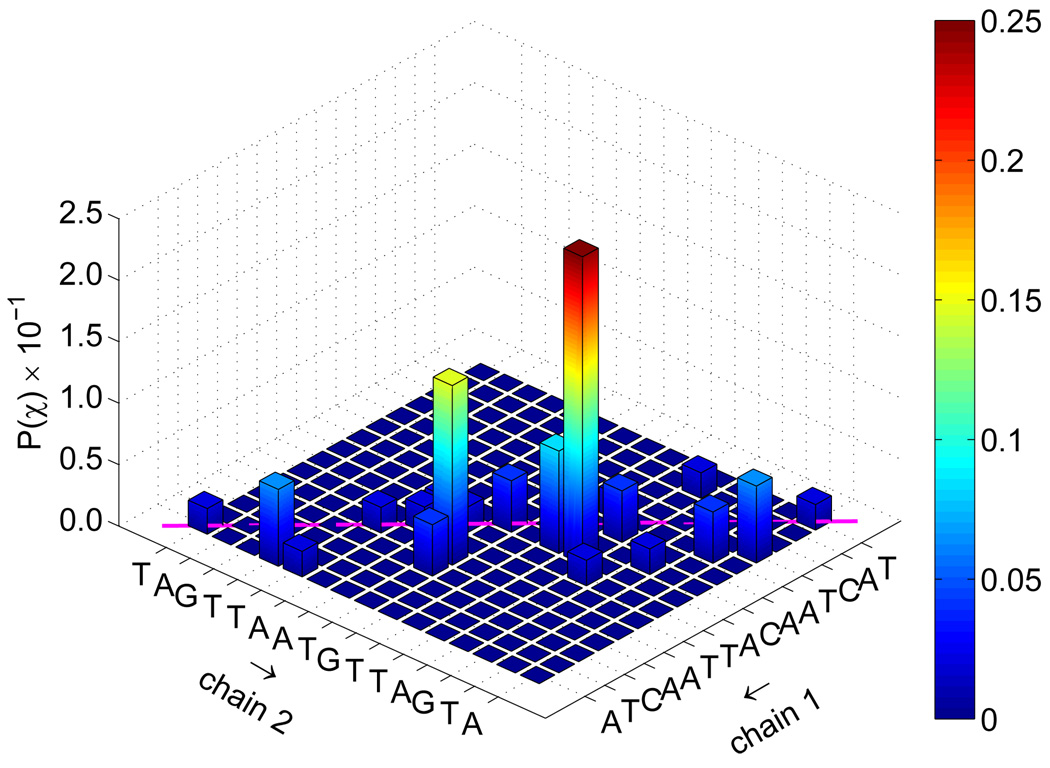
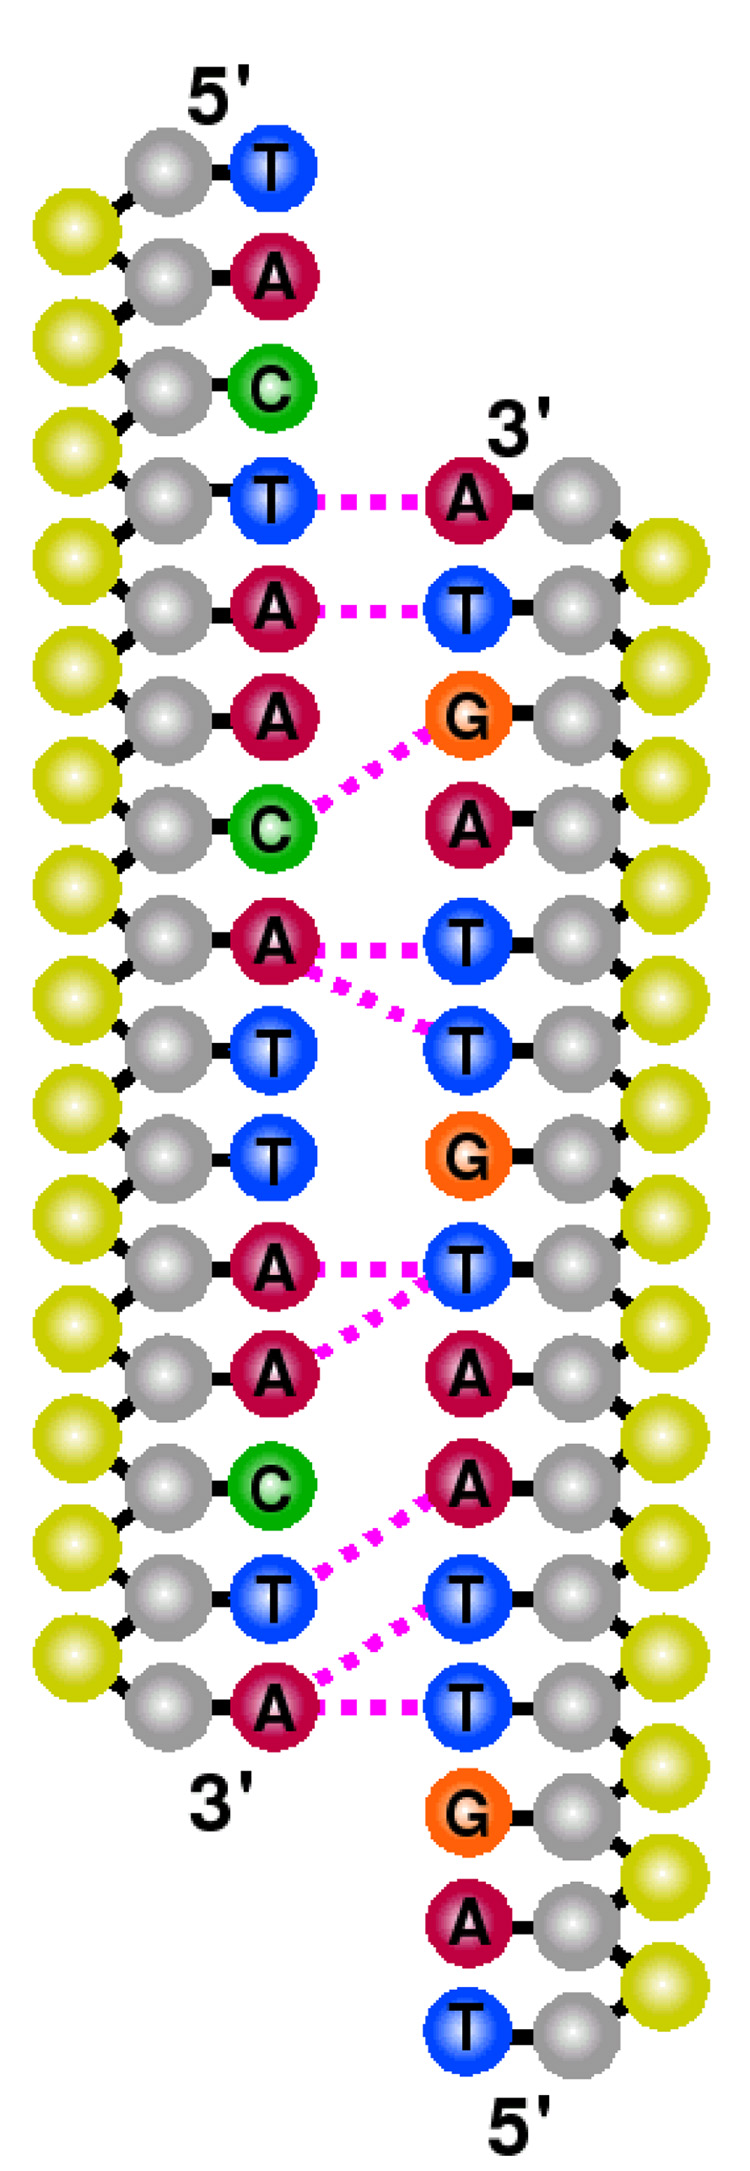
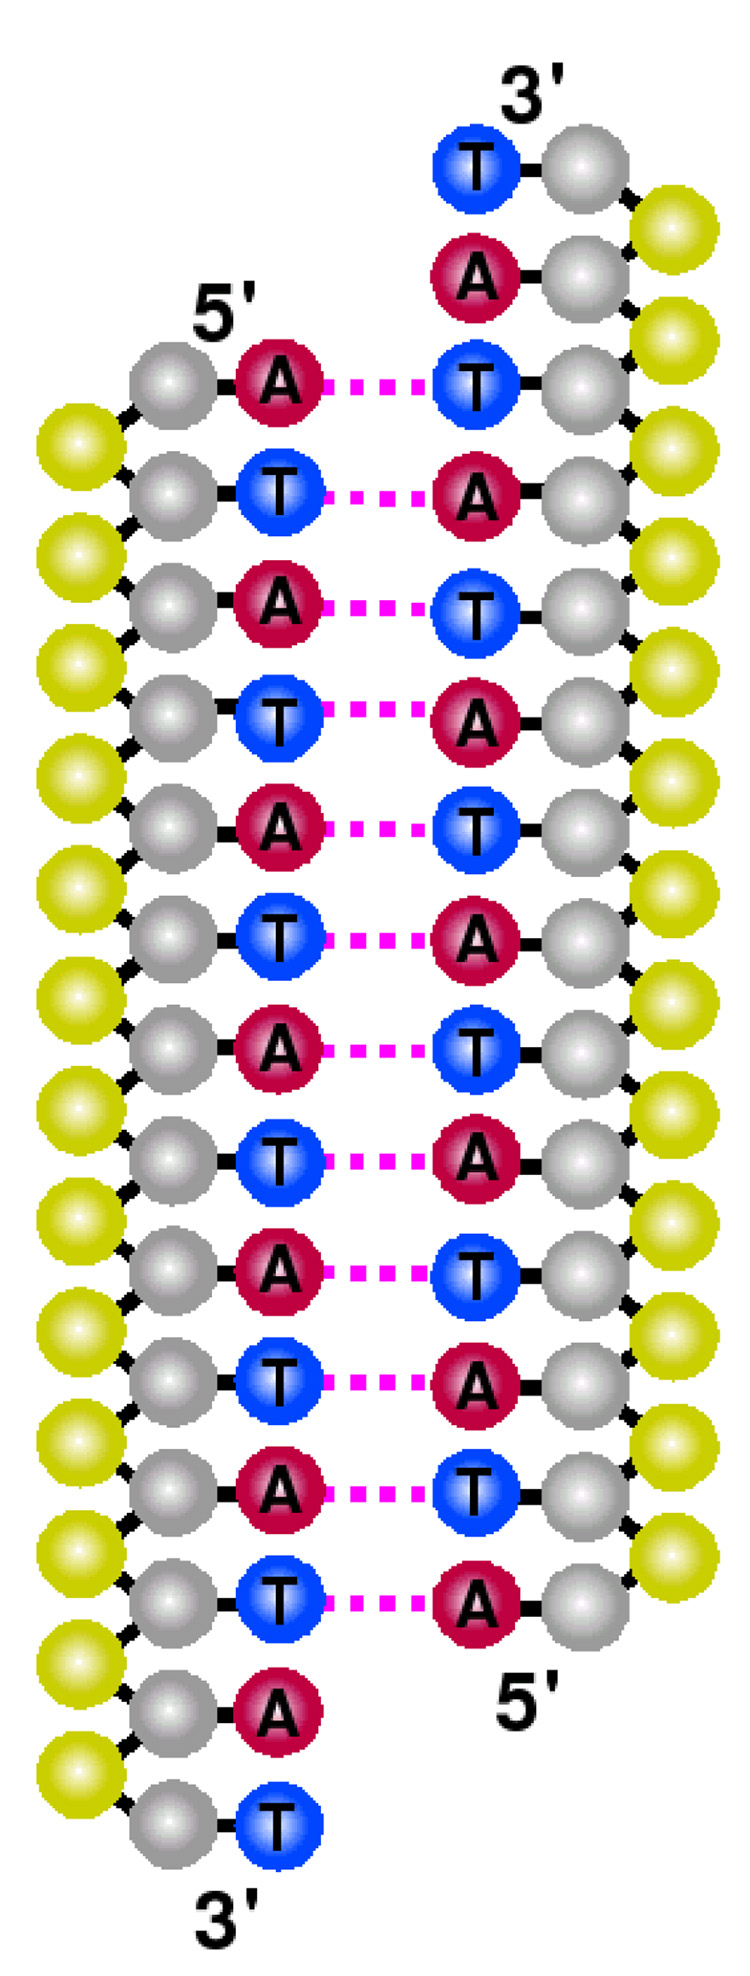
The renaturation/denaturation of DNA oligonucleotides is characterized in the context of expanded ensemble (EXE) and transition path sampling (TPS) simulations. Free energy profiles have been determined from EXE for DNA sequences of varying composition, chain length, and ionic strength. TPS simulations within a Langevin dynamics formalism have been carried out to obtain further information of the transition state for renaturation. Simulation results reveal that free energy profiles are strikingly similar for the various DNA sequences considered in this work. Taking intact double-stranded DNA to have an extent of reaction ξ = 1.0, the maximum of the free energy profile appears at ξ≈0.15, corresponding to ∼2 base pairs. In terms of chain length, the free energy barrier of longer oligonucleotides (30 versus 15 base pairs) is higher and slightly narrower, due to increased sharpness associated with the transition. Low ionic strength tends to decrease free energy barriers, whereby increasing strand rigidity facilitates reassociation. Two mechanisms for DNA reassociation emerge from our analysis of the transition state ensemble. Repetitive sequences tend to reassociate through a non-specific pathway involving molecular slithering. In contrast, random sequences associate through a more restrictive pathway involving the formation of specific contacts, which then leads to overall molecular zippering. In both random and repetitive sequences, the distribution of contacts suggests that nucleation is favored for sites located within the middle region of the chain. The prevalent extent of reaction for the transition state is ξ≈0.25, and the critical size of the nucleus as obtained from our analysis involves ∼4 base pairs.
Figures
Similar articles
-
Uncovering pathways in DNA oligonucleotide hybridization via transition state analysis.Proc Natl Acad Sci U S A. 2009 Oct 27;106(43):18125-30. doi: 10.1073/pnas.0904721106. Epub 2009 Oct 8. Proc Natl Acad Sci U S A. 2009. PMID: 19815517 Free PMC article.
-
Denaturation and renaturation behaviors of short DNA in a confined space.J Chem Phys. 2014 Jul 28;141(4):044911. doi: 10.1063/1.4891219. J Chem Phys. 2014. PMID: 25084960
-
A mesoscale model of DNA and its renaturation.Biophys J. 2009 Mar 4;96(5):1675-90. doi: 10.1016/j.bpj.2008.09.061. Biophys J. 2009. PMID: 19254530 Free PMC article.
-
Stabilities of double- and triple-strand helical nucleic acids.Prog Biophys Mol Biol. 1992;58(3):225-57. doi: 10.1016/0079-6107(92)90007-s. Prog Biophys Mol Biol. 1992. PMID: 1380719 Review.
-
Comparing brute force to transition path sampling for gas hydrate nucleation with a flat interface: comments on time reversal symmetry.Phys Chem Chem Phys. 2024 Feb 14;26(7):5762-5772. doi: 10.1039/d3cp05059a. Phys Chem Chem Phys. 2024. PMID: 38214888 Review.
Cited by
-
A coarse-grain three-site-per-nucleotide model for DNA with explicit ions.J Chem Phys. 2011 Oct 28;135(16):165104. doi: 10.1063/1.3652956. J Chem Phys. 2011. PMID: 22047269 Free PMC article.
-
Theory on the Mechanism of DNA Renaturation: Stochastic Nucleation and Zipping.PLoS One. 2016 Apr 13;11(4):e0153172. doi: 10.1371/journal.pone.0153172. eCollection 2016. PLoS One. 2016. PMID: 27074030 Free PMC article.
-
A coarse-grained model of DNA with explicit solvation by water and ions.J Phys Chem B. 2011 Jan 13;115(1):132-42. doi: 10.1021/jp107028n. Epub 2010 Dec 14. J Phys Chem B. 2011. PMID: 21155552 Free PMC article.
-
Molecular origins of DNA flexibility: sequence effects on conformational and mechanical properties.Phys Rev Lett. 2011 Jun 10;106(23):238107. doi: 10.1103/PhysRevLett.106.238107. Epub 2011 Jun 10. Phys Rev Lett. 2011. PMID: 21770550 Free PMC article.
-
Determining Sequence-Dependent DNA Oligonucleotide Hybridization and Dehybridization Mechanisms Using Coarse-Grained Molecular Simulation, Markov State Models, and Infrared Spectroscopy.J Am Chem Soc. 2021 Oct 27;143(42):17395-17411. doi: 10.1021/jacs.1c05219. Epub 2021 Oct 13. J Am Chem Soc. 2021. PMID: 34644072 Free PMC article.
References
-
- Wartell RM, Benight AS. Thermal denaturation of DNA molecules: a comparison of theory with experiment. Phys. Rep. 1985;126(2):67–107.
-
- Hill TL. Generalization of the one-dimensional Ising model applicable to helix transitions in nucleic acids and proteins. J. Chem. Phys. 1959;30:383–387.
-
- Lifson S, Zimm BH. Simplified theory of the helix-coil transition in DNA based on a grand partition function. Biopolymers. 1963;1:15–23.
-
- Marmur J, Rownd R, Schildkraut CL. Denaturation and renaturation of deoxyribonucleic acid. Prog. Nucleic Acid Res. 1963;1:231–300.
-
- Rau DC, Klotz LC. A unified theory of nucleation-rate-limited DNA renaturation kinetics. Biophys. Chem. 1978;8:41–51. - PubMed
Grants and funding
LinkOut - more resources
Full Text Sources
Other Literature Sources