. 2011;6(7):e21976.
doi: 10.1371/journal.pone.0021976. Epub 2011 Jul 19.

Graph theoretical analysis of functional brain networks: test-retest evaluation on short- and long-term resting-state functional MRI data

Affiliations

Graph theoretical analysis of functional brain networks: test-retest evaluation on short- and long-term resting-state functional MRI data

Jin-Hui Wang et al. PLoS One. 2011.

Abstract

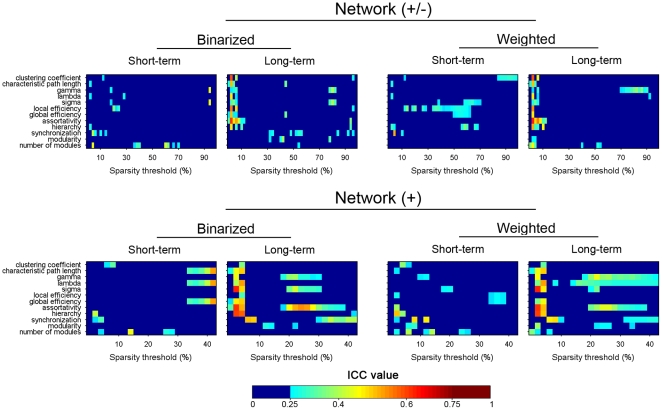
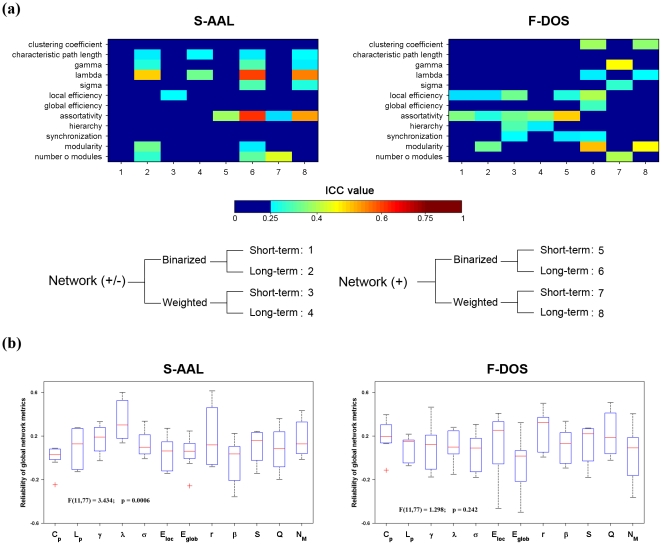
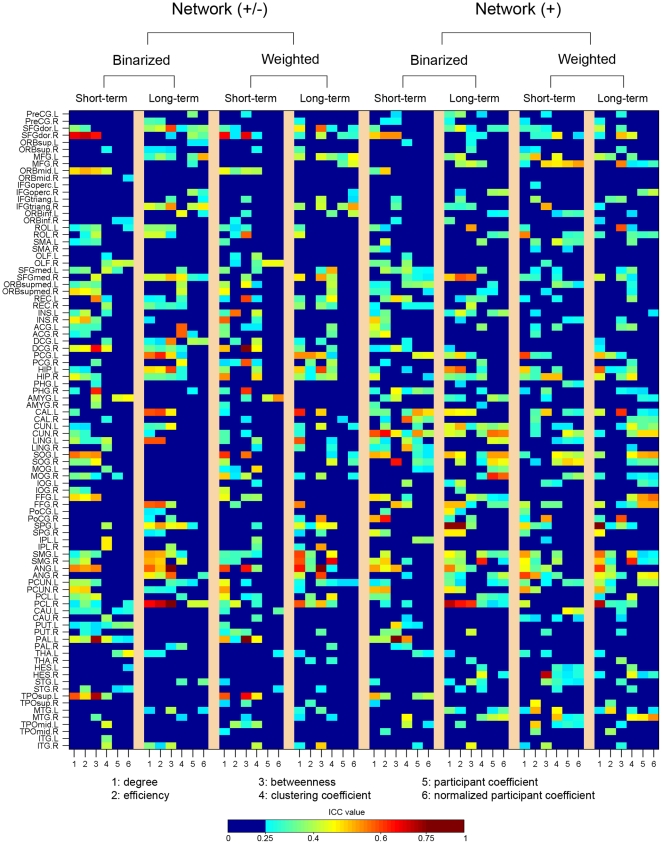
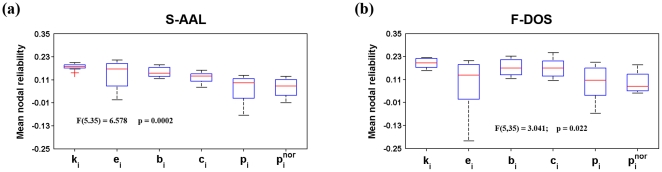
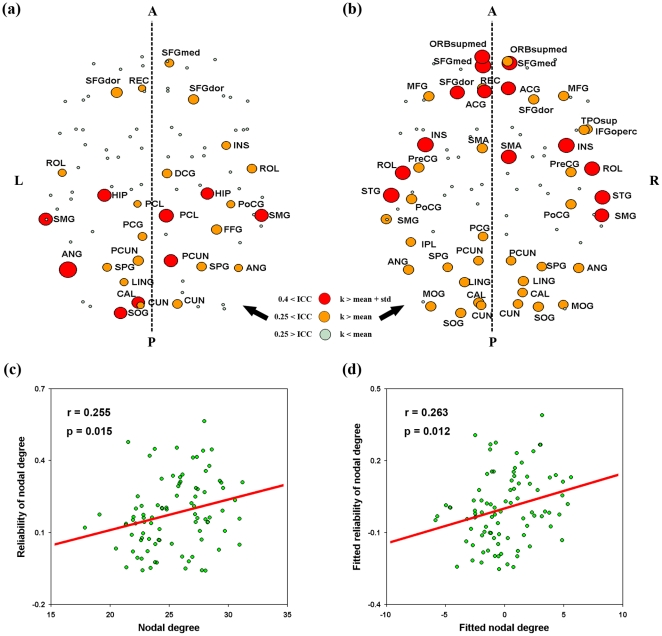
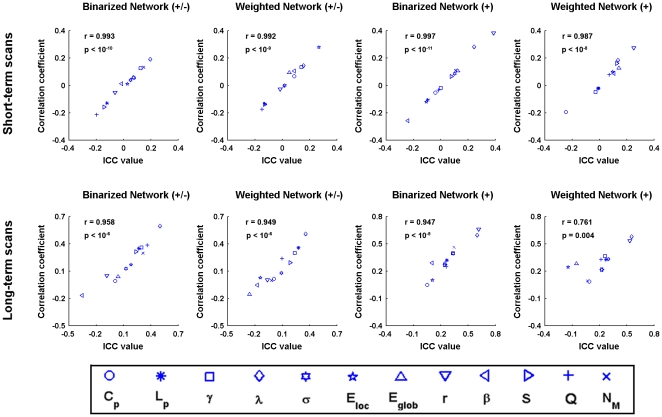
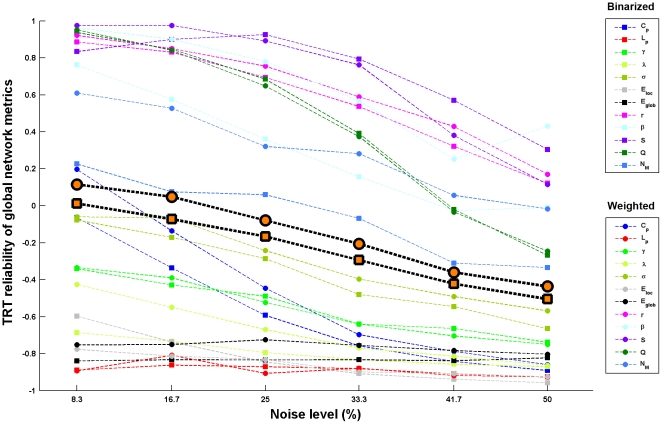
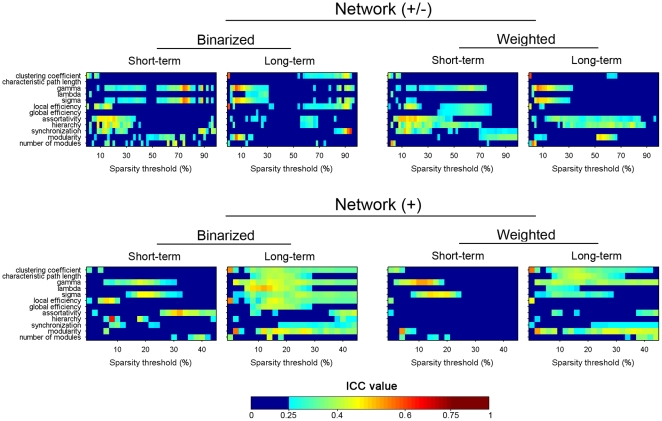
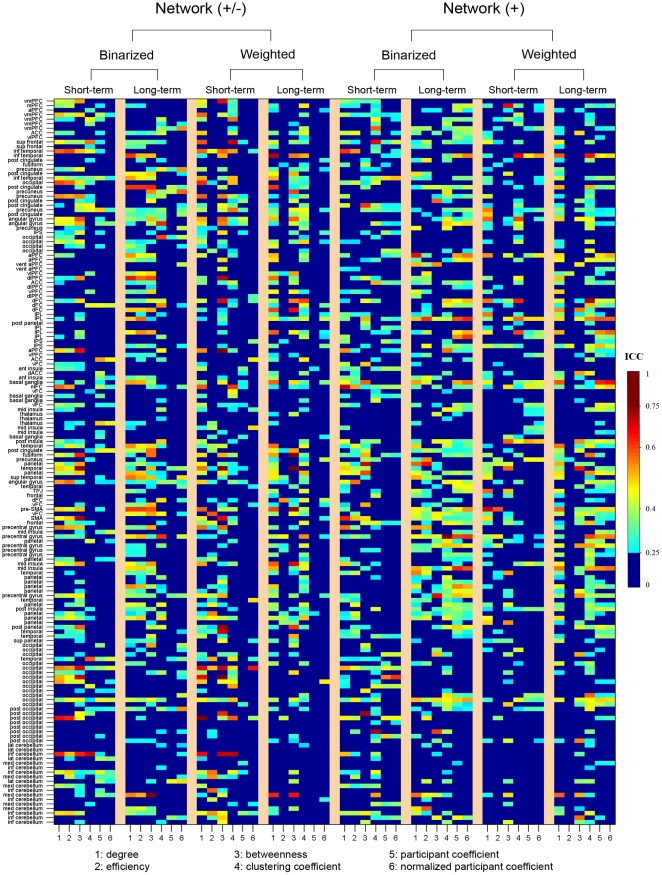
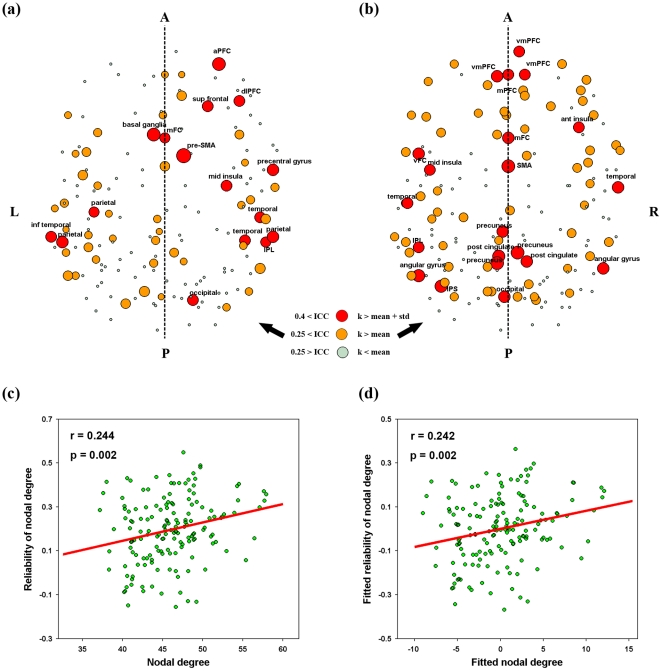
Graph-based computational network analysis has proven a powerful tool to quantitatively characterize functional architectures of the brain. However, the test-retest (TRT) reliability of graph metrics of functional networks has not been systematically examined. Here, we investigated TRT reliability of topological metrics of functional brain networks derived from resting-state functional magnetic resonance imaging data. Specifically, we evaluated both short-term (<1 hour apart) and long-term (>5 months apart) TRT reliability for 12 global and 6 local nodal network metrics. We found that reliability of global network metrics was overall low, threshold-sensitive and dependent on several factors of scanning time interval (TI, long-term>short-term), network membership (NM, networks excluding negative correlations>networks including negative correlations) and network type (NT, binarized networks>weighted networks). The dependence was modulated by another factor of node definition (ND) strategy. The local nodal reliability exhibited large variability across nodal metrics and a spatially heterogeneous distribution. Nodal degree was the most reliable metric and varied the least across the factors above. Hub regions in association and limbic/paralimbic cortices showed moderate TRT reliability. Importantly, nodal reliability was robust to above-mentioned four factors. Simulation analysis revealed that global network metrics were extremely sensitive (but varying degrees) to noise in functional connectivity and weighted networks generated numerically more reliable results in compared with binarized networks. For nodal network metrics, they showed high resistance to noise in functional connectivity and no NT related differences were found in the resistance. These findings provide important implications on how to choose reliable analytical schemes and network metrics of interest.


Conflict of interest statement

Competing Interests: The authors have declared that no competing interests exist.

Figures

Figure 1
Figure 1. Spatial similarity and TRT reliability patterns of S-AAL-based RSFC.
Mean Pearson correlation matrices (a), consistency of overall patterns between mean matrices (b) and TRT reliability of individual connections as well as the relationship between short-term and long-term reliability (c) are illustrated. The mean correlation matrices exhibited high similarity from both visual inspection (a) and quantitative spatial correlation analyses (b). Further TRT reliability analyses revealed a portion of connections exhibiting fair to excellent reliability (c, also see Fig. 2). Moreover, short-term reliability was significantly (p<0.05) correlated with long-term reliability among connections (c). Functional connections linking inter-hemisphere homotopic regions, as highlighted by plus signs (+), showed high connectivity strength and many of them exhibited high reliability. TRT, test-retest; RSFC, resting-state functional connectivity; S-AAL, structural ROIs from Anatomical Automatic Labeling atlas. Of note, the structural ROIs were listed as in Table S1.
Figure 2
Figure 2. TRT reliability distribution of RSFC.
Both short-term and long-term TRT reliability exhibit approximatively normal distribution for all ROI sets. The mean reliability was about 0.28 (short-term) and 0.24 (long-term) for both structural ROIs-based RSFC while relatively low values were observed for functional ROIs-based RSFC. Green dots indicate the critical values used in the present study to grade reliability. RSFC, resting-state functional connectivity; TRT, test-retest.
Figure 3
Figure 3. Relationship between RSFC and TRT reliability.
Scatter plots of mean connectivity strength against corresponding ICC values are depicted to show the relationship for both S-AAL (a) and F-DOS (b) based correlation matrices. The trend lines were obtained by linear least-square fit. Significant (p<0.05) positive correlations were found between positive RSFC and their corresponding ICC values for both ROIs sets and for both short-term and long-term scanning. In addition, significant negative correlations were also found for negative RSFC with their corresponding ICC values but only for F-DOS-based correlation matrices. These findings suggest higher reliability for stronger RSFC. Functional connections linking inter-hemisphere homotopic regions are highlighted by plus signs (+) for S-AAL but not for F-DOS because of the absence of direct correspondence. RSFC, resting-state functional connectivity; TRT, test-retest; S-AAL, structural ROIs from Anatomical Automatic Labeling atlas; F-DOS, functional ROIs from Dosenbach et al. (2006, 2010).
Figure 4
Figure 4. Spatial similarity and TRT reliability patterns of F-DOS-based RSFC.
Mean Pearson correlation matrices (a), consistency of overall patterns between mean matrices (b) and TRT reliability of individual connections as well as the relationship between short-term and long-term reliability (c) are illustrated. The mean correlation matrices exhibited high similarity from both visual inspection (a) and quantitative spatial correlation analyses (b). Further TRT reliability analyses revealed many connections exhibiting fair to excellent reliability (c, also see Fig. 2). Moreover, a significant (p<0.05) correlation was found in the ICC matrices between short-term and long-term scans (c). No inter-hemisphere homotopic functional connections were highlighted because of the absence of direct inter-hemisphere correspondence for these ROIs. TRT, test-retest; RSFC, resting-state functional connectivity; F-DOS, functional ROIs from Dosenbach et al. (2006, 2010). Of note, the functional ROIs were listed as in Table S3.
Figure 5
Figure 5. TRT reliability of global network metrics as a function of sparsity threshold for S-AAL-based networks.
ICC values less than 0.25 were mapped to a single color of dark blue as well dark red color for ICC values greater than 0.75, respectively. Network (+/-), networks constructed using absolute both positive and negative correlations; Network (+), networks constructed using only positive correlations; Binarized, binarized network anlysis; Weighted, weighted network analysis; TRT, test-retest; S-AAL, structural ROIs from Anatomical Automatic Labeling atlas.
Figure 6
Figure 6. TRT reliability of summarized global network metrics (a) and metric-related differences in reliability (b).
Areas under curves (AUCs) of each metrics were used to provide threshold-independent reliability estimation. Different metrics showed variable levels of reliability. Several of them were moderately reliable (e.g., lambda for S-AAL-based networks). Subsequent statistical analysis revealed significant differences in TRT reliability among the 12 global network metrics for S-AAL- but not for F-DOS-based networks. ICC values less than 0.25 were mapped to a single color of dark blue as well dark red color for ICC values greater than 0.75, respectively in (a). Network (+/-), networks constructed using absolute both positive and negative correlations; Network (+), networks constructed using only positive correlations; Binarized, binarized network analysis; Weighted, weighted network analysis; TRT, test-retest; S-AAL, structural ROIs from Anatomical Automatic Labeling atlas; F-DOS, functional ROIs from Dosenbach et al. (2006, 2010).
Figure 7
Figure 7. TRT reliability of nodal metrics for S-AAL-based networks.
Nodal reliability varied across nodal attributes and spatial locations. The full names of region's abbreviations were listed as in Table S1. ICC values less than 0.25 were mapped to a single color of dark blue as well dark red color for ICC values greater than 0.75, respectively. Network (+/-), networks constructed using absolute both positive and negative correlations; Network (+), networks constructed using only positive correlations; Binarized, binarized network analysis; Weighted, weighted network analysis; TRT, test-retest; S-AAL, structural ROIs from Anatomical Automatic Labeling atlas.
Figure 8
Figure 8. Boxplot of mean nodal TRT reliability for S-AAL- (a) and F-DOS- (b) based networks.
Significant differences were found in the mean nodal reliability among the six nodal metrics examined with nodal degree showing the highest ICC values and least variances for both ROIs sets. TRT, test-retest; S-AAL, structural ROIs from Anatomical Automatic Labeling atlas; F-DOS, functional ROIs from Dosenbach et al. (2006, 2010).
Figure 9
Figure 9. Nodal TRT reliability of degree and its relationship with nodal degree centrality for S-AAL-based networks.
(a) Nodal TRT reliability was mapped in anatomical space after average across scanning time interval, network type and network membership because of no effects of these factors on nodal reliability. (b) Nodal degree centrality (AUCs) was also mapped in anatomical space which was averaged across subjects and factors of scanning time interval, network type and network membership. Trend lines were further obtained by linear least-square fit to reveal the relationship between nodal degree centrality and their corresponding reliability after with (d) and without (c) correcting for the effects of regional size. Of note, the full names of region's abbreviations were listed as in Table S1. TRT, test-retest; S-AAL, structural ROIs from Anatomical Automatic Labeling atlas; k, nodal degree; A, anterior; P, posterior; L, left; R, right.
Figure 10
Figure 10. The similarity between inter-scan ICC-based reliability and inter-scan Pearson correlation coefficients for S-AAL-based networks.
The reliability and correlation analyses revealed highly consistent results (r>0.9 under most conditions), ruling out the possibility of linear scaling biases of network metrics across test and retest scans that will lead to low TRT reliability.
Figure 11
Figure 11. TRT reliability of global network metrics as a function of noise in RSFC for S-AAL-based networks.
Global network metrics were sensitive to disturbances of RSFC and weighted network analysis generated numerically more stable results in comparison with binarized network analysis. The highlighted black border marks are the average reliability across metrics for binarized (square) and weighted (circle) network analysis, respectively. Of note, the sensitivity varied dramatically among metrics. Small-world parameters and network efficiency were extremely sensitive to even little noise in functional connectivity while assortativity, hierarchy, synchronization and modularity were relatively resistant to noise. TRT, test-retest; RSFC, resting-state functional connectivity.
Figure 12
Figure 12. TRT reliability of nodal network metrics as a function of noise in RSFC for S-AAL-based networks.
Nodal network metrics were sensitive to disturbances of RSFC and no differences were observed in the resistance to noise in functional connectivity between binarized and weighted network analysis. The highlighted black border marks are the average reliability across metrics for binarized (square) and weighted (circle) network analysis, respectively. Of note, although sensitive, nodal network metrics showed strong tolerance of disturbances in RSFC. TRT, test-retest; RSFC, resting-state functional connectivity.
Figure 13
Figure 13. TRT reliability of global network metrics as a function of sparsity threshold for F-DOS-based networks.
ICC values less than 0.25 were mapped to a single color of dark blue as well dark red color for ICC values greater than 0.75, respectively. Multiple network metrics showed modest reliability in certain threshold range. Network (+/-), networks constructed using absolute both positive and negative correlations; Network (+), networks constructed using only positive correlations; Binarized, binarized network anlysis; Weighted, weighted network analysis; TRT: test-retest; F-DOS, functional ROIs from Dosenbach et al. (2006, 2010).
Figure 14
Figure 14. TRT reliability of nodal metrics for F-DOS-based networks.
Nodal reliability varied across nodal attributes and spatial locations. The full names of region's abbreviations were listed as in Table S3. ICC values less than 0.25 were mapped to a single color of dark blue as well dark red color for ICC values greater than 0.75, respectively. Network (+/-), networks constructed using absolute both positive and negative correlations; Network (+), networks constructed using only positive correlations; Binarized, binarized network analysis; Weighted, weighted network analysis; TRT, test-retest; F-DOS, functional ROIs from Dosenbach et al. (2006, 2010).
Figure 15
Figure 15. Nodal TRT reliability of degree and its relationship with nodal degree centrality for F-DOS-based networks.
(a) Nodal TRT reliability was mapped in anatomical space after average across scanning time interval, network type and network membership because of no effects of these factors on nodal reliability. (b) Nodal degree centrality (AUCs) was also mapped in anatomical space which was averaged across subjects and factors of scanning time interval, network type and network membership. Trend lines were further obtained by linear least-square fit to reveal the relationship between nodal degree centrality and their corresponding reliability after with (d) and without (c) correcting for the effects of regional size. Of note, the full names of region's abbreviations were listed as in Table S1. TRT, test-retest; F-DOS, functional ROIs from Dosenbach et al. (2006, 2010); k, nodal degree; A, anterior; P, posterior; L, left; R, right.

References

    1. Sporns O, Tononi G, Kotter R. The human connectome: A structural description of the human brain. PLoS Comput Biol. 2005;1:e42. - PMC - PubMed
    1. Biswal BB, Mennes M, Zuo XN, Gohel S, Kelly C, et al. Toward discovery science of human brain function. Proc Natl Acad Sci U S A. 2010;107:4734–4739. - PMC - PubMed
    1. Bullmore E, Sporns O. Complex brain networks: graph theoretical analysis of structural and functional systems. Nat Rev Neurosci. 2009;10:186–198. - PubMed
    1. He Y, Evans A. Graph theoretical modeling of brain connectivity. Curr Opin Neurol. 2010;23:341–350. - PubMed
    1. Guye M, Bettus G, Bartolomei F, Cozzone PJ. MAGMA; 2010. Graph theoretical analysis of structural and functional connectivity MRI in normal and pathological brain networks. - PubMed

Publication types