

doi: 10.1371/journal.pone.0022678.
Epub 2011 Jul 26.
Quantitative photo activated localization microscopy: unraveling the effects of photoblinking
Affiliations
- PMID: 21818365
- PMCID: PMC3144238
- DOI: 10.1371/journal.pone.0022678
Item in Clipboard
Quantitative photo activated localization microscopy: unraveling the effects of photoblinking
PLoS One.
2011.
Abstract
In this work we discuss how to use photophysical information for improved quantitative measurements using Photo Activated Localization Microscopy (PALM) imaging. We introduce a method that reliably estimates the number of photoblinking molecules present in a biological sample and gives a robust way to quantify proteins at the single-cell level from PALM images. We apply this method to determine the amount of β2 adrenergic receptor, a prototypical G Protein Coupled Receptor, expressed on the plasma membrane of HeLa cells.
Conflict of interest statement
Figures

a) Experimental (markers) and simulated (blue line) total numbers of mEos2 molecules localized as a function of dark time td, where dark time td is time allowed for a molecule to go dark before being identified as a different molecule when fluorescence resumes. Simulated counts, out of total, ascribed respectively to missed counts (green), multiple counts (pink) and noise (gray). For all samples the duration of the acquisition is 20000×50 ms frames. Red curve shows best fit to data for dark time td values comprised between 0.05 s and 2 s. If no missed counts were to occur, the asymptote of the decaying curve of the observed counts would converge to the effective number of molecules present in the sample. Fitting to the equation (1) yields toff = 0.2±0.1 s and <nblinks> = 0.7±0.1 consistent with what reported respectively in b) and c) and Figure S2.
N from the fit yields N = 121±6 molecules/µm2 whereas the total density of the simulated sample is 135 molecules/µm2 including noise counts, giving a 10% agreement. b) Histogram of the number of times an mEos2 molecule undergoes photoblinking before definitive photobleaching. Experimental values and single exponential best fits are shown, 1/e decay values is <n_blinks> = 1.05±0.11. c) Histogram of the measured off-times toff-high = 0.1±0.01 s d) Left: single molecule kymographs of 6 blinking/reactivating molecules. The duration of the dark times spans from 1 to 4 units (0.05–0.15 s), resulting in the off-times histograms on the right. If now molecular localizations are performed considering a dark time td as 0.05 s, 0.1 s and 0.15 s the resulting number of counts are 13, 9, and 7 respectively. The difference between these values corresponds to the values of the off-time histogram e) Calibration curve for the concentrations extracted by fitting eq. 1 to PALM data. Blue circles: reconstructed concentration from PALM experiment (0.06 molecules/µm2/nM in TIRF) vs absorbance-derived concentration and best fit. Each point corresponds to the average of PALM experiments on three different samples. Red markers display the ratio between the concentration extracted directly from PALM at td = 0.05 s and the concentration obtained using our method.
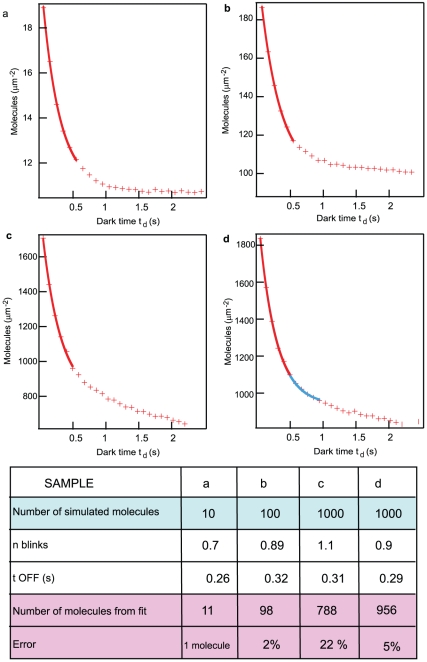
Simulated PALM experiments on in-silico samples generated at three different densities while keeping the photophysical parameters constant. a) 10, b) 100 and c) and d) 1000 molecules/µm2 . The simulated counts curves are fitted to equation (1), using only the first 5 points of the curve, up to a td = 50*10 ms = 0.5 s. a) 10 molecules/µm2 we observe an error of 1 particle/µm2 between the value extracted from the fit and the number of molecules present in the in-silico experiment, b) 100 molecules/µm2 we observe an error of 2% that goes up to c) 20% at 1000/µm2. However, upon reducing the photoactivation power in the densest sample d) this error reduces to approximately 5%. By reducing the photoactivation rate of a factor three, the fit can be extended (blue curve) up to 30 photoactivation cycles obtaining an error of 7%.
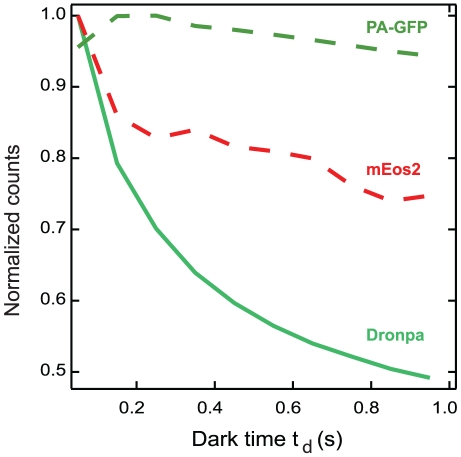
Normalized number of localized molecules vs td for three different photo-activatable fluorescent proteins, PA-GFP, Dronpa and mEos2.

a) Red Markers - number of localized molecules as a function of dark time td with density estimation in the cell. Molecules localized in a 1 µm2 region of the plasma membrane of the fixed HeLa cell expressing β2-mEos2 displayed in b). Blue line -fit using equation (1) limited to the overcounting regime yields an estimated density of approximately 60 molecules/µm2, toff = 0.36±0.05 s and nblink = 0.63±0.07. b) TIRF-PALM image of a region of the cell expressing β2-mEos2 (td = 10 s, localization precision<35 nm) in c) its corresponding TIRF image d), e), f), and g) insets from a) displaying isolated localized receptors by a gaussian function for 4 different dark time values d) td = 0.5 s e) td = 1 s f) td = 5 s and g) td = 10 s.
References
-
- Burns DH, Callis JB, Christian GD, Davidson ER. Strategies for Attaining Superresolution Using Spectroscopic Data as Constraints. Applied Optics. 1985;24:154–161. - PubMed
-
- Bornfleth H, Satzler K, Eils R, Cremer C. High-precision distance measurements and volume-conserving segmentation of objects near and below the resolution limit in three-dimensional confocal fluorescence microscopy. Journal of Microscopy-Oxford. 1998;189:118–136.
-
- Heilemann M, Herten DP, Heintzmann R, Cremer C, Muller C, et al. High-resolution colocalization of single dye molecules by fluorescence lifetime imaging microscopy. Analytical Chemistry. 2002;74:3511–3517. - PubMed
MeSH terms
Substances
LinkOut - more resources
Full Text Sources
Other Literature Sources
