Influence of climate on emergency department visits for syncope: role of air temperature variability
- PMID: 21818372
- PMCID: PMC3144938
- DOI: 10.1371/journal.pone.0022719
Influence of climate on emergency department visits for syncope: role of air temperature variability
Abstract
Background: Syncope is a clinical event characterized by a transient loss of consciousness, estimated to affect 6.2/1000 person-years, resulting in remarkable health care and social costs. Human pathophysiology suggests that heat may promote syncope during standing. We tested the hypothesis that the increase of air temperatures from January to July would be accompanied by an increased rate of syncope resulting in a higher frequency of Emergency Department (ED) visits. We also evaluated the role of maximal temperature variability in affecting ED visits for syncope.
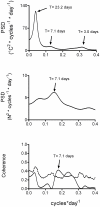
Methodology/principal findings: We included 770 of 2775 consecutive subjects who were seen for syncope at four EDs between January and July 2004. This period was subdivided into three epochs of similar length: 23 January-31 March, 1 April-31 May and 1 June-31 July. Spectral techniques were used to analyze oscillatory components of day by day maximal temperature and syncope variability and assess their linear relationship. There was no correlation between daily maximum temperatures and number of syncope. ED visits for syncope were lower in June and July when maximal temperature variability declined although the maximal temperatures themselves were higher. Frequency analysis of day by day maximal temperature variability showed a major non-random fluctuation characterized by a ∼23-day period and two minor oscillations with ∼3- and ∼7-day periods. This latter oscillation was correlated with a similar ∼7-day fluctuation in ED visits for syncope.
Conclusions/significance: We conclude that ED visits for syncope were not predicted by daily maximal temperature but were associated with increased temperature variability. A ∼7-day rhythm characterized both maximal temperatures and ED visits for syncope variability suggesting that climate changes may have a significant effect on the mode of syncope occurrence.
Conflict of interest statement
Figures


References
-
- Soteriades ES, Evans JC, Larson MG, Chen MH, Chen L, et al. Incidence and prognosis of syncope. N Engl J Med. 2002;347:878–885. - PubMed
-
- Wilson TE, Cui J, Zhang R, Witkowski S, Crandall CG. Skin cooling maintains cerebral blood flow velocity and orthostatic tolerance during tilting in heated humans. J Appl Physiol. 2002;93:85–91. - PubMed
MeSH terms
LinkOut - more resources
Full Text Sources
Medical
Miscellaneous

