. 2011 Nov;35(7):620-31.
doi: 10.1002/gepi.20610. Epub 2011 Aug 4.

Kernel machine SNP-set analysis for censored survival outcomes in genome-wide association studies

Affiliations

Kernel machine SNP-set analysis for censored survival outcomes in genome-wide association studies

Xinyi Lin et al. Genet Epidemiol. 2011 Nov.

Abstract

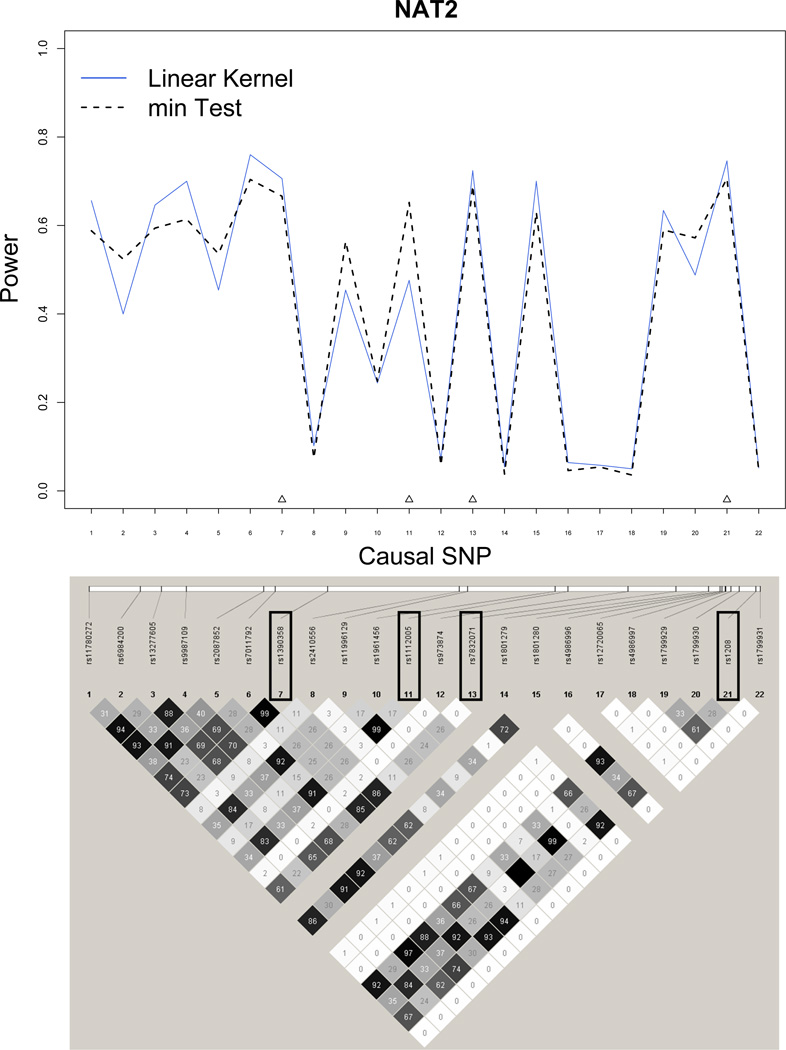
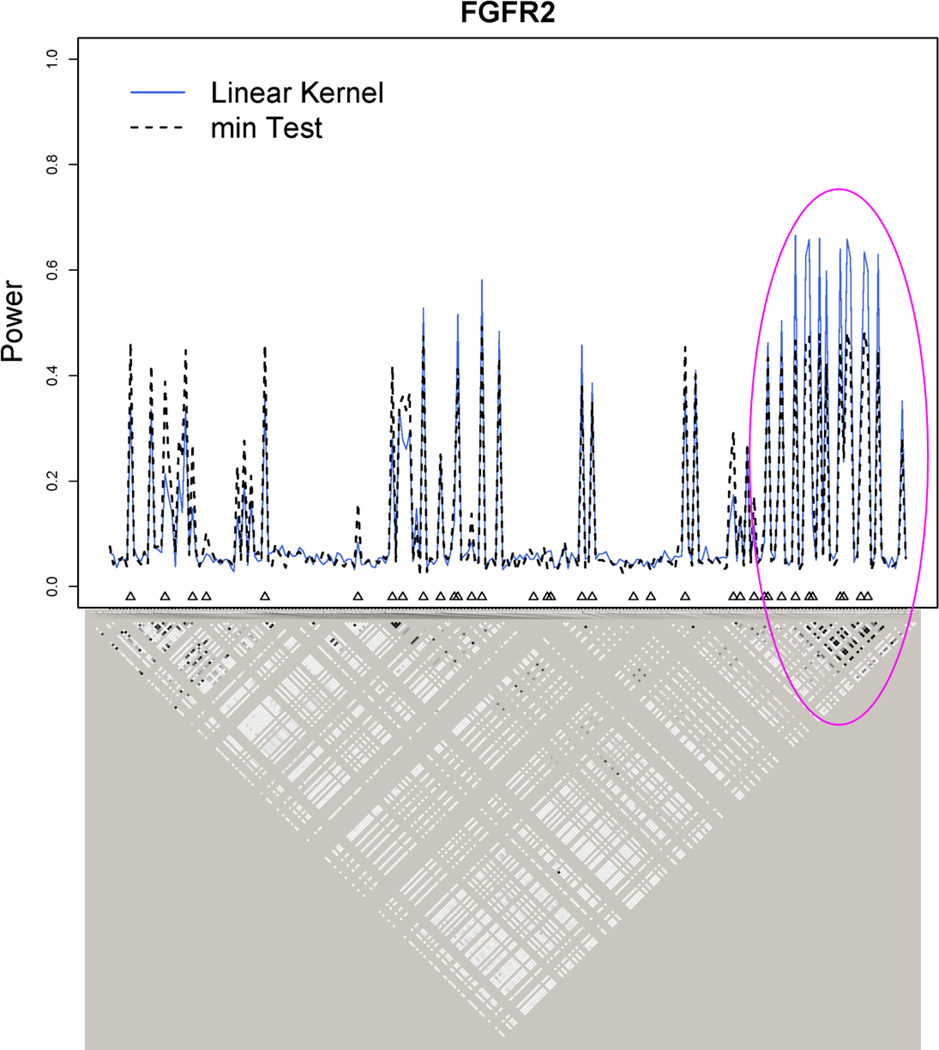
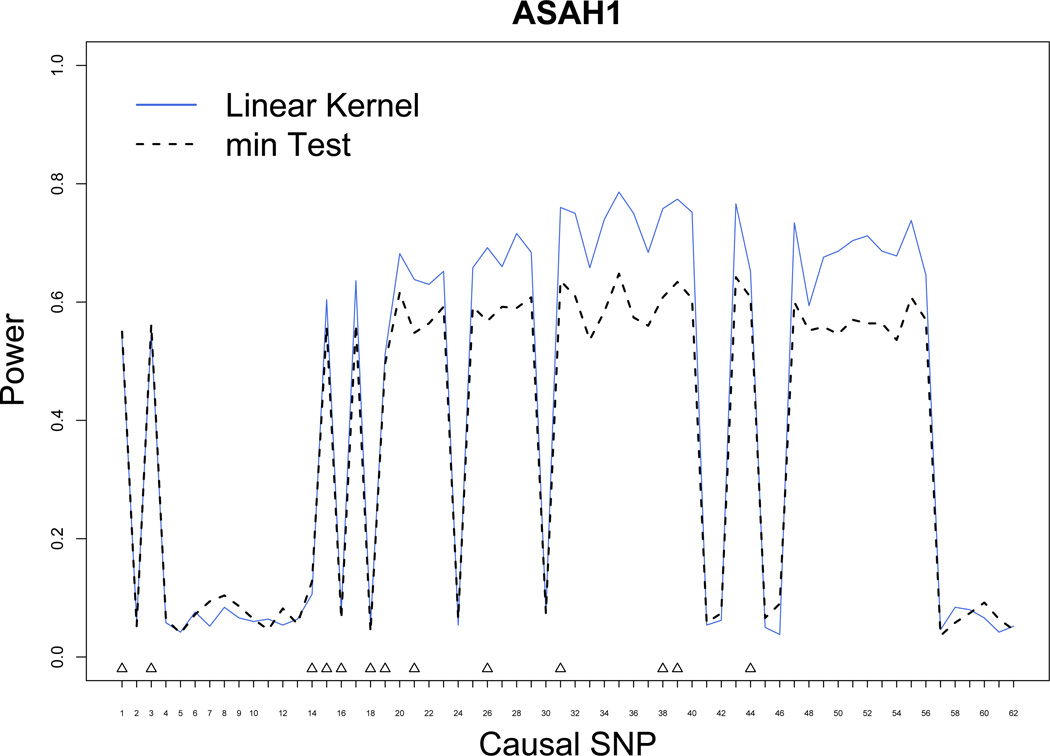
In this article, we develop a powerful test for identifying single nucleotide polymorphism (SNP)-sets that are predictive of survival with data from genome-wide association studies. We first group typed SNPs into SNP-sets based on genomic features and then apply a score test to assess the overall effect of each SNP-set on the survival outcome through a kernel machine Cox regression framework. This approach uses genetic information from all SNPs in the SNP-set simultaneously and accounts for linkage disequilibrium (LD), leading to a powerful test with reduced degrees of freedom when the typed SNPs are in LD with each other. This type of test also has the advantage of capturing the potentially nonlinear effects of the SNPs, SNP-SNP interactions (epistasis), and the joint effects of multiple causal variants. By simulating SNP data based on the LD structure of real genes from the HapMap project, we demonstrate that our proposed test is more powerful than the standard single SNP minimum P-value-based test for association studies with censored survival outcomes. We illustrate the proposed test with a real data application.


Figures

Figure 1
Figure 1
Power Simulations for ASAH1. Blue solid line: power for Kernel Regression method. Black dashed line: power for min test. Typed SNPs are indicated with upright triangles.
Figure 2
Figure 2
Kernel machine method has higher power than the min test when median R2 of the causal SNP with the typed SNPs is sufficiently high - Power Simulations for ASAH1. The causal SNPs on the x-axis are sorted by median R2 with the typed SNPs. Typed SNPs are indicated with upright triangles at the bottom. Blue solid line: power for Kernel Regression method. Black dashed line: power for min test. Red dotted line: minor allele frequency of causal SNP. Purple dotted and dashed line: median R2 of causal SNP with the typed SNPs.
Figure 3
Figure 3
Power Simulations for ASAH1. Blue solid line: power for Linear Kernel. Red dotted line: Power for IBS kernel. Purple dotted and dashed line: Power for weighted IBS kernel. Black dashed line: power for min test. Typed SNPs are indicated with upright triangles.
Figure 4
Figure 4
min test can have higher power than the kernel machine method when the true causal SNP (or one in high LD with it) is typed and tested and not in LD with other typed SNPs - Power Simulations for NAT2. Blue solid line: power for Kernel Regression method. Black dashed line: power for min test. Typed SNPs are indicated with upright triangles.
Figure 5
Figure 5
Kernel machine method outperforms the min test in regions of high LD - Power Simulations for FGFR2. Blue solid line: power for Kernel Regression method. Black dashed line: power for min test. Typed SNPs are indicated with upright triangles.
Figure 6
Figure 6
Power Simulations for ASAH1 using both typed and imputed SNPs. Blue solid line: power for Kernel Regression method. Black dashed line: power for min test. Typed SNPs are indicated with upright triangles.

References

    1. Azzato E, Pharoah P, Harrington P, Easton D, Greenberg D, et al. A genome-wide association study of prognosis in breast cancer. Cancer Epidemiology, Biomarkers and Prevention. 2010;19:1140–1143. - PMC - PubMed
    1. Barrett J, Fry B, Maller J, Daly M. Haploview: analysis and visualization of LD and haplotype maps. Bioinformatics. 2005;21:263–265. - PubMed
    1. Cai T, Tonini G, Lin X. Kernel machine approach to testing the significance of multiple genetic markers for risk prediction. Biometrics. 2011 no. - PMC - PubMed
    1. Chapman J, Cooper J, Todd J, Clayton D. Detecting disease associations due to linkage disequilibrium using haplotype tags: a class of tests and the determinants of statistical power. Human Heredity. 2003;56:1831. - PubMed
    1. Cheverud J. A simple correction for multiple comparisons in interval mapping genome scans. Heredity. 2001;87:52–58. - PubMed

Publication types