. 2011 Aug 5:5:122.
doi: 10.1186/1752-0509-5-122.

A retrosynthetic biology approach to metabolic pathway design for therapeutic production

Affiliations

A retrosynthetic biology approach to metabolic pathway design for therapeutic production

Pablo Carbonell et al. BMC Syst Biol. .

Abstract

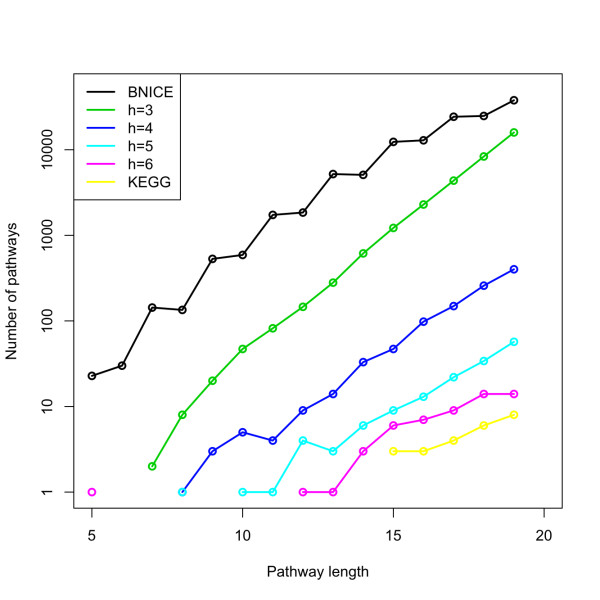
Background: Synthetic biology is used to develop cell factories for production of chemicals by constructively importing heterologous pathways into industrial microorganisms. In this work we present a retrosynthetic approach to the production of therapeutics with the goal of developing an in situ drug delivery device in host cells. Retrosynthesis, a concept originally proposed for synthetic chemistry, iteratively applies reversed chemical transformations (reversed enzyme-catalyzed reactions in the metabolic space) starting from a target product to reach precursors that are endogenous to the chassis. So far, a wider adoption of retrosynthesis into the manufacturing pipeline has been hindered by the complexity of enumerating all feasible biosynthetic pathways for a given compound.

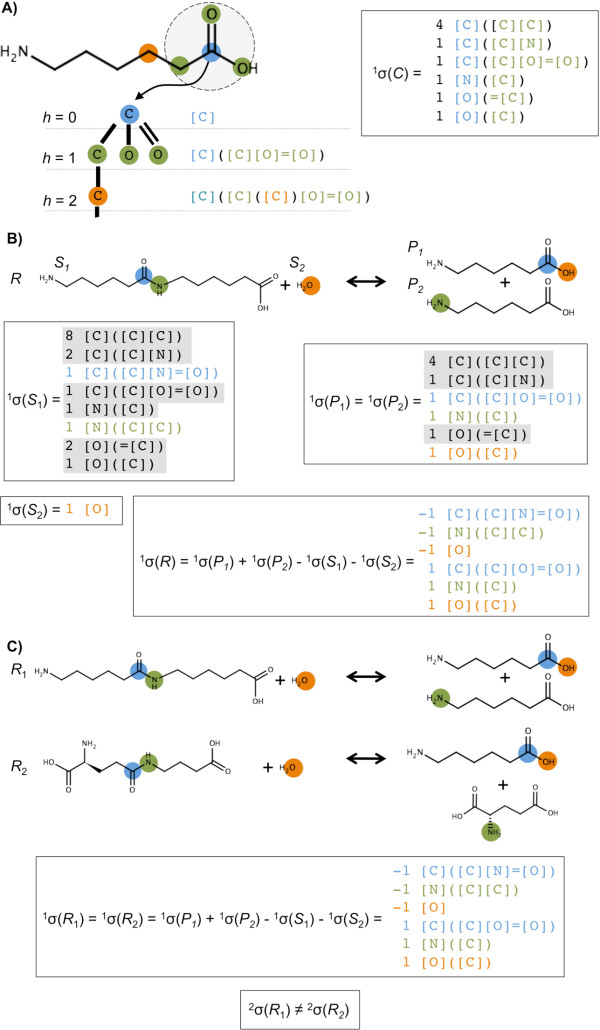
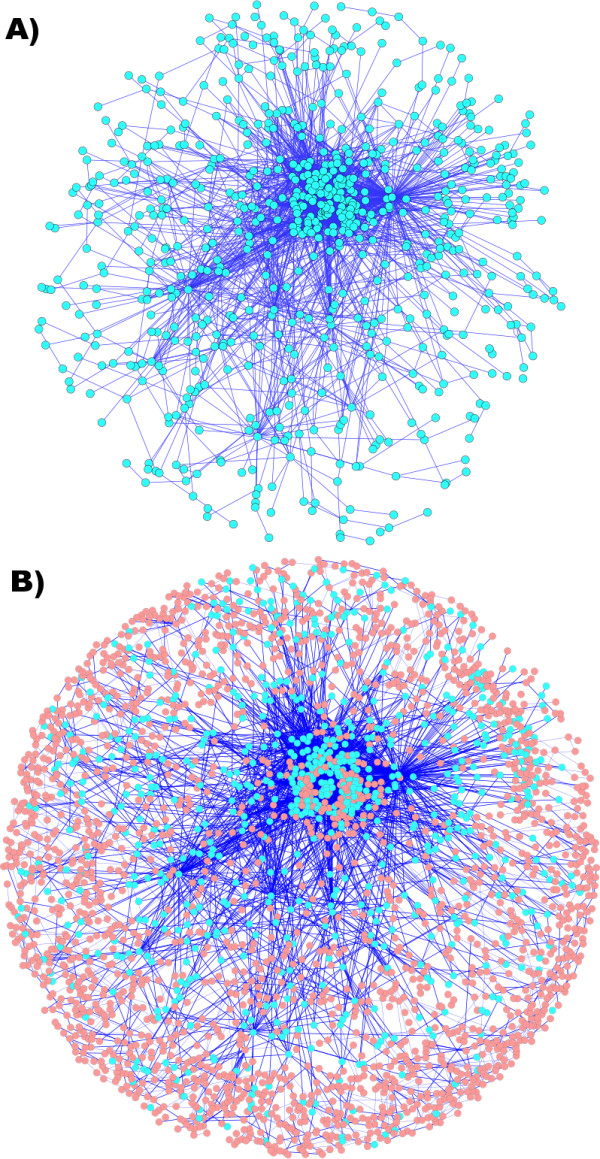
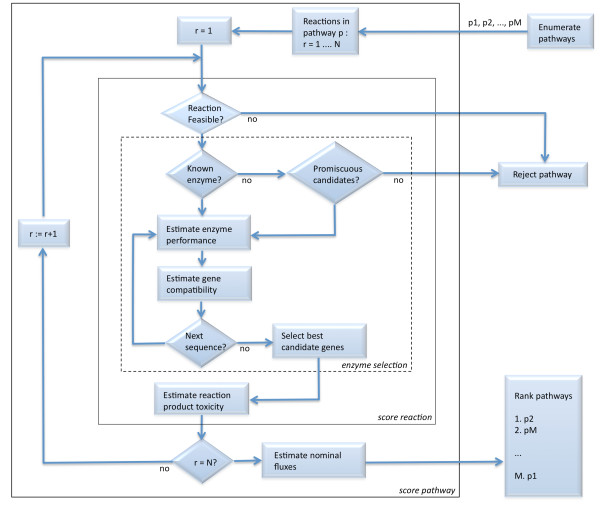
Results: In our method, we efficiently address the complexity problem by coding substrates, products and reactions into molecular signatures. Metabolic maps are represented using hypergraphs and the complexity is controlled by varying the specificity of the molecular signature. Furthermore, our method enables candidate pathways to be ranked to determine which ones are best to engineer. The proposed ranking function can integrate data from different sources such as host compatibility for inserted genes, the estimation of steady-state fluxes from the genome-wide reconstruction of the organism's metabolism, or the estimation of metabolite toxicity from experimental assays. We use several machine-learning tools in order to estimate enzyme activity and reaction efficiency at each step of the identified pathways. Examples of production in bacteria and yeast for two antibiotics and for one antitumor agent, as well as for several essential metabolites are outlined.

Conclusions: We present here a unified framework that integrates diverse techniques involved in the design of heterologous biosynthetic pathways through a retrosynthetic approach in the reaction signature space. Our engineering methodology enables the flexible design of industrial microorganisms for the efficient on-demand production of chemical compounds with therapeutic applications.


Figures

Figure 1
Figure 1
The atomic, molecular and reaction signature coding. A) The process for computing the molecular signature for a compound C is illustrated for 6-aminohexanate. The process starts by computing the atomic signature for each atom. In the given example, the atomic signature for the carbon in the carboxylic group is computed up to height h = 2. At height h = 0 (blue), the molecular graph rooted at the atom is given by the atom itself; at height h = 1 (green) a canonical representation of the root atom and its first atomic neighbors are given; the process continues similarly for heights h = 2 (orange) and higher until the diameter of the graph is reached. Atomic signatures are collected for all atoms and sorted in order to provide the molecular signature, for instance the molecular signature 1σ(C) of height h = 1 is given at the left; B) The coding of reactions signatures is illustrated for the 6-aminohexanoate hydrolase (EC 3.5.1.46). The reaction signature contains the net difference between the products and the substrates. In the figure, the reaction signature 1σ(R) was computed for height h = 1; C) Illustration of how signatures of reactions provide a way to measure their chemical similarity. For example, the previous reaction (EC 3.5.1.46) has the same signature at height h = 1 than 4-(γ-glutamylamino)butanoate amidohydrolase (EC 3.5.1.94). However, both signatures differ at height h = 2, having in this case a Tanimoto similarity of 2s(R1, R2) = 0.81 (see Equation 14 in Methods).
Figure 2
Figure 2
Metabolic networks in the EMRS. A) Metabolic reaction map of E. coli, where endogenous metabolites are depicted as light blue nodes connected by edges representing reactions; B) Retrosynthetic map containing reachable compounds in the E. coli EMRS through exogenous reactions, where exogenous metabolites are represented by pink nodes connected through reactions (thin edges) to the E. coli network. There are 966 endogenous and 2338 exogenous compounds, respectively, that can be reached through reactions in the EMRS. There are 4,344 edges connecting endogenous compounds and 8,931 edges leading to exogenous compounds.
Figure 3
Figure 3
Flowchart for ranking pathways. In order to rank pathways, each reaction r = 1 ... N in the enumerated pathways p1 ... pM is first tested for thermodynamical feasibility; enzyme candidates are subsequently tested for performance and homogeneity so that the one with the lowest cost is selected; the cost of toxicity of each reaction product is then added; finally, the nominal flux is estimated for the overall pathway.
Figure 4
Figure 4
Controlling the complexity of the pathway enumeration problem through molecular signatures. Comparison between pathway length distributions between tyrosine and chorismate for novel reactions generated by the BEM representation (BNICE) [33], the EMRS of heights h = 3 to 6, and the original reactions in the KEGG metabolic database.
Figure 5
Figure 5
Retrosynthetic pathways for production of DrugBank compounds in E. coli. Percentage of compounds in the DrugBank database with alternative biosynthetic pathways in E. coli.
Figure 6
Figure 6
Retrosynthetic maps for the production in E. coli of A) penicillin G and B) cephalosporin. Compounds in gray are endogenous to the chassis organism (E. coli); enzymatic reactions are represented as circles; branching compounds, which can be produced by more than one biochemical transformation, are (S)-2,3,4,5-tetrahydropyridine-2-carboxylate, L-2-aminoadipate-6-semialdehyde; the target compound is at the bottom of the plot.
Figure 7
Figure 7
Retrosynthetic map for the production of paclitaxel (taxol) in yeast. Compounds in gray are endogenous to the chassis organism (S. cerevisiae); enzymatic reactions are represented as circles; 10-deactyl-2-debenzoylbaccatin III appears as a branching compound; the target compound is at the bottom of the plot.

Similar articles

Cited by

References

    1. Elowitz M, Lim WA. Build life to understand it. Nature. 2010;468(7326):889–890. doi: 10.1038/468889a. - DOI - PMC - PubMed
    1. Keasling JD. Manufacturing Molecules Through Metabolic Engineering. Science. 2010;330(6009):1355–1358. doi: 10.1126/science.1193990. - DOI - PubMed
    1. Khalil AS, Collins JJ. Synthetic biology: applications come of age. Nat Rev Genet. 2010;11(5):367–379. - PMC - PubMed
    1. Ro DK, Paradise EM, Ouellet M, Fisher KJ, Newman KL, Ndungu JM, Ho KA, Eachus RA, Ham TS, Kirby J, Chang MCY, Withers ST, Shiba Y, Sarpong R, Keasling JD. Production of the antimalarial drug precursor artemisinic acid in engineered yeast. Nature. 2006;440(7086):940–943. doi: 10.1038/nature04640. - DOI - PubMed
    1. Ajikumar PK, Xiao WH, Tyo KEJ, Wang Y, Simeon F, Leonard E, Mucha O, Phon TH, Pfeifer B, Stephanopoulos G. Isoprenoid Pathway Optimization for Taxol Precursor Overproduction in Escherichia coli. Science. 2010;330(6000):70–74. doi: 10.1126/science.1191652. - DOI - PMC - PubMed

Publication types

LinkOut - more resources