. 2011 Nov;32(33):8436-45.
doi: 10.1016/j.biomaterials.2011.07.056. Epub 2011 Aug 4.

Changes of chondrocyte expression profiles in human MSC aggregates in the presence of PEG microspheres and TGF-β3

Affiliations

Changes of chondrocyte expression profiles in human MSC aggregates in the presence of PEG microspheres and TGF-β3

Soumya Ravindran et al. Biomaterials. 2011 Nov.

Abstract

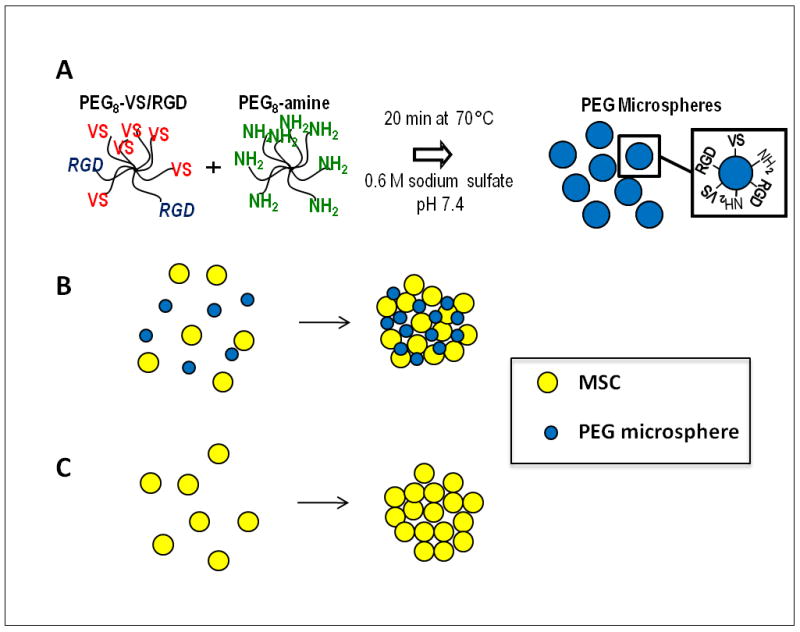
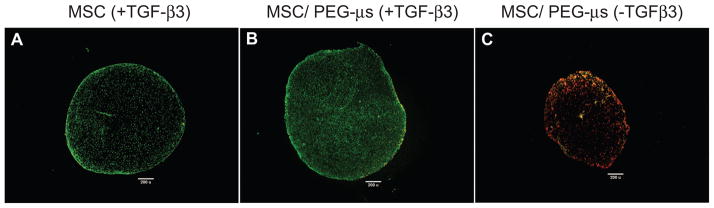
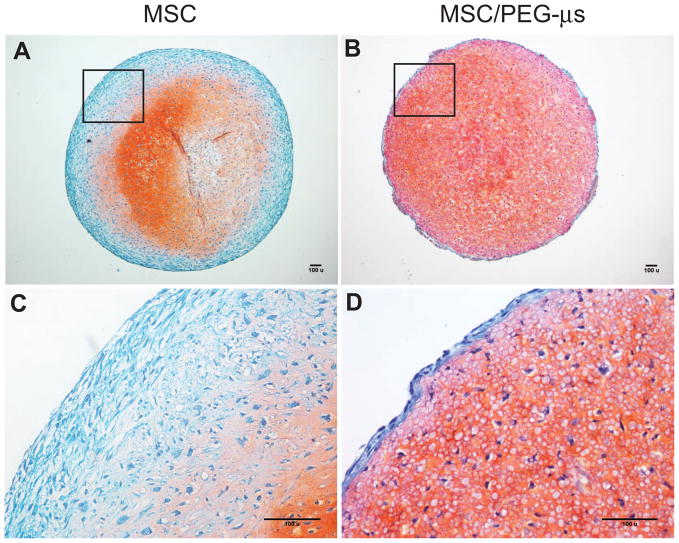
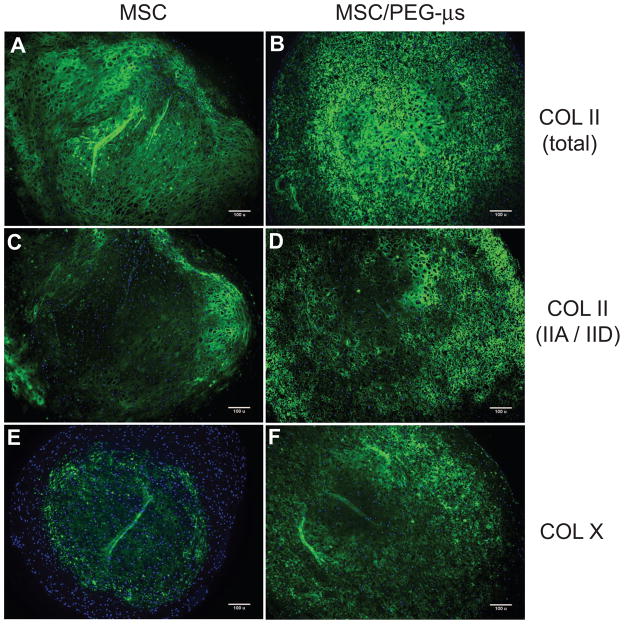
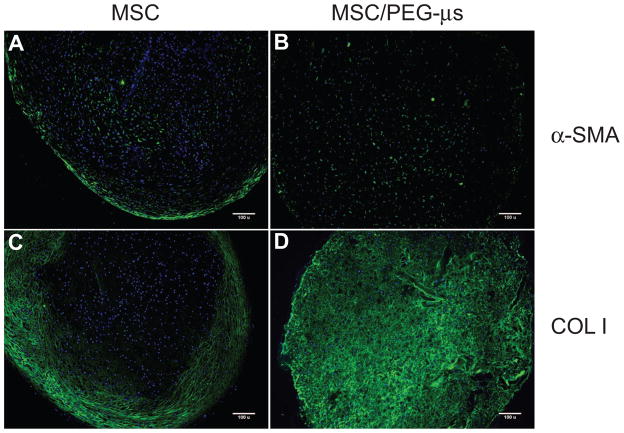
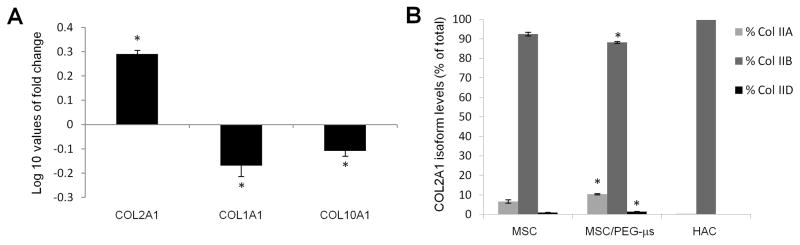
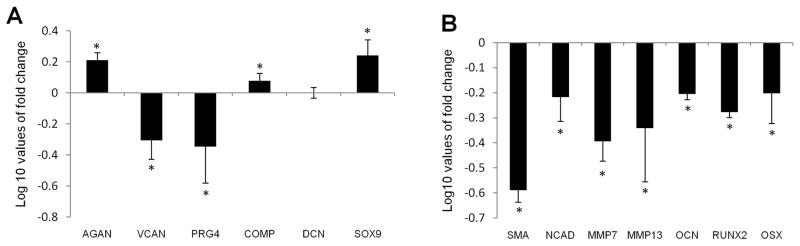
Biomaterial microparticles are commonly utilized as growth factor delivery vehicles to induce chondrogenic differentiation of mesenchymal stem/stromal cells (MSCs). To address whether the presence of microparticles could themselves affect differentiation of MSCs, a 3D co-aggregate system was developed containing an equal volume of human primary bone marrow-derived MSCs and non-degradable RGD-conjugated poly(ethylene glycol) microspheres (PEG-μs). Following TGF-β3 induction, differences in cell phenotype, gene expression and protein localization patterns were found when compared to MSC aggregate cultures devoid of PEG-μs. An outer fibrous layer always found in differentiated MSC aggregate cultures was not formed in the presence of PEG-μs. Type II collagen protein was synthesized by cells in both culture systems, although increased levels of the long (embryonic) procollagen isoforms were found in MSC/PEG-μs aggregates. Ubiquitous deposition of type I and type X collagen proteins was found in MSC/PEG-μs cultures while the expression patterns of these collagens was restricted to specific areas in MSC aggregates. These findings show that MSCs respond differently to TGF-β3 when in a PEG-μs environment due to effects of cell dilution, altered growth factor diffusion and/or cellular interactions with the microspheres. Although not all of the expression patterns pointed toward improved chondrogenic differentiation in the MSC/PEG-μs cultures, the surprisingly large impact of the microparticles themselves should be considered when designing drug delivery/scaffold strategies.


Figures

Figure 1
Figure 1. Generation of MSC/PEG-μs aggregates
(A) Procedure for generation of PEG microspheres (PEG-μs) of approximately 6.01±1.98 μm in diameter containing RGD peptides (Ac-GCGYGRGDSPG-NH2) by phase inversion polymerization. (B) Microspheres and MSCs were mixed 1:1 (v/v) and rotated for 3 h to allow attachment of the cells to the microspheres. This was followed by centrifugation to form the aggregates. (C) As a control, MSC aggregates without PEG-μs were also generated.
Figure 2
Figure 2. Cell viability within aggregate cultures by co-staining with calcein and ethidium homodimer
The Live/Dead staining reagent contains a combination of both calcein and ethidium homodimer vital dyes. Fluorescence images demonstrated numerous calcein-stained cells (green, viable) within MSC aggregate cultures (A) or MSC/PEG-μs aggregate cultures (B) following 28 days of TGF-β3 induction. In contrast, only ethidium homodimer-positive cells (red, non viable) are shown in fluorescent images of MSC/PEG-μs aggregates cultured for 28 days in the absence of TGF-β3 (C). Scale bars = 200 μm.
Figure 3
Figure 3. Proteoglycan synthesis
Safranin-O stained MSC (A) and MSC/PEG-μs (B) aggregates following 28 days of TGF-β3 induction. Panels C and D are higher magnification images of the boxed regions in A and B, respectively. Scale bars = 100 μm. Safranin-O staining patterns following 12 days of TGF-β3 induction are shown in Supplemental Figure 2.
Figure 4
Figure 4. Localization of type II collagen and type X collagen
Antibodies against the fibrillar portion of type II collagen (total COL II) (A and B) or the exon 2-encoded protein domain in the amino propeptide of type II collagen (COL IIA/IID) (C and D) were used. Type X collagen (COL X) localization is shown in panels E and F. Fluorescence immunohistochemistry was carried out on micro-thin (10 μm) paraffin sections of MSC aggregate cultures (A, C, E) or MSC/PEG-μs aggregate cultures (B, D, F) that had been induced for 28 days with TGF-β3. Antibody staining (green), with DAPI nuclear stain (blue). Scale bars = 100 μm.
Figure 5
Figure 5. Localization of α-SMA and type I collagen
Fluorescence immunohistochemistry was carried out on micro-thin (10μm) paraffin sections of MSC aggregate cultures (A, C) or MSC/PEG-μs aggregate cultures (B, D) that had been induced for 28 days with TGF-β3. α-SMA distribution is shown in panels A and B; type I collagen (COL I) localization is shown in panels C and D. Antibody staining (green), with DAPI nuclear stain (blue). Scale bars = 100 μm.
Figure 6
Figure 6. Collagen gene expression in MSC and MSC/PEG-μs aggregate cultures following 28 days of TGF-β3 induction
(A) Levels of genes encoding type II collagen (COL2A1), type I collagen (COL1A1) and type X collagen (COL10A1) in MSC/PEG-μs cultures were expressed as Log 10 values of fold change when compared to expression in MSC aggregate cultures. (B) Using a TaqMan-based assay, levels of each COL2A1 isoform (IIA, IIB, IID) was expressed as a percentage of the total COL2A1 isoforms for both culture systems. Expression levels in human articular chondrocytes (HAC) are also shown. All differences in expression levels of each COL2A1 isoform between MSC/PEG-μs cultures and the MSC aggregate cultures were calculated as significant based on the two-sample Student’s t-test (n=6; * indicates p < 0.05 versus MSC aggregates).
Figure 7
Figure 7. Gene expression in MSC and MSC/PEG-μs aggregate cultures following 28 days of TGF-β3 induction
(A) Genes encoding the cartilage matrix components aggrecan (AGAN), versican (VCAN), lubricin (PRG-4), cartilage oligomeric matrix protein (COMP) and decorin (DCN) and transcription factor SOX9 were analyzed. (B) Also investigated were genes encoding alpha-smooth muscle actin (α-SMA), N-Cadherin (NCAD), matrix metalloproteinase-7 (MMP-7), MMP-13, osteocalcin (OCN), Runx2 and osterix (OSX) (B). Expression levels of all genes in MSC/PEG-μs cultures are represented as Log 10 fold changes when compared to expression in MSC aggregate cultures. All differences in expression levels between the two cultures systems were calculated as significant (except for DCN) based on the two-sample Student’s t-test (n=6; * indicates p < 0.05 versus MSC aggregates).

Similar articles

Cited by

References

    1. Ulrich-Vinther M, Maloney MD, Schwarz EM, Rosier R, O’Keefe RJ. Articular cartilage biology. J Am Acad Orthop Surg. 2003;11:421–30. - PubMed
    1. Hollander AP, Dickinson SC, Kafienah W. Stem cells and cartilage development: complexities of a simple tissue. Stem Cells. 2010;28:1992–6. - PMC - PubMed
    1. Daher RJ, Chahine NO, Greenberg AS, Sgaglione NA, Grande DA. New methods to diagnose and treat cartilage degeneration. Nat Rev Rheumatol. 2009;5:599–607. - PubMed
    1. Nelson L, Fairclough J, Archer CW. Use of stem cells in the biological repair of articular cartilage. Expert Opin Biol Th. 2010;10:43–55. - PubMed
    1. Keeney M, Lai JH, Yang F. Recent progress in cartilage tissue engineering. Curr Opin Biotechnol. 2011 doi: 10.1016/j.copbio.2011.04.003. Available from URL: http://www.ncbi.nlm.nih.gov/pubmed/21531126. - DOI - PubMed

Publication types

MeSH terms