. 2011 Aug 23;21(16):1347-55.
doi: 10.1016/j.cub.2011.07.018. Epub 2011 Aug 4.

Nocturnin regulates circadian trafficking of dietary lipid in intestinal enterocytes

Affiliations

Nocturnin regulates circadian trafficking of dietary lipid in intestinal enterocytes

Nicholas Douris et al. Curr Biol. .

Abstract

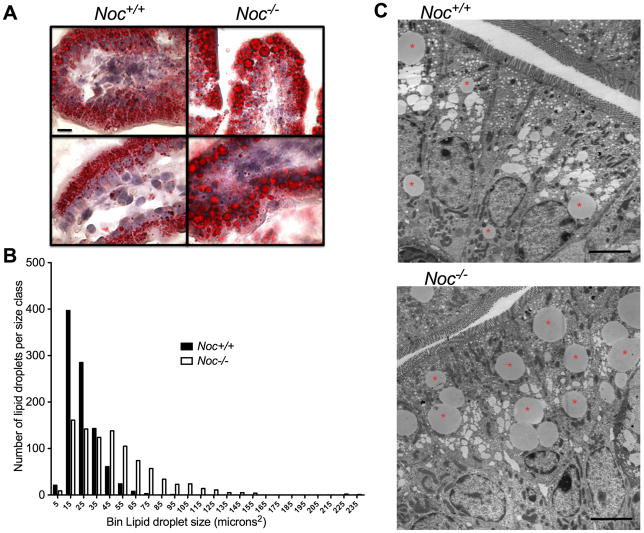
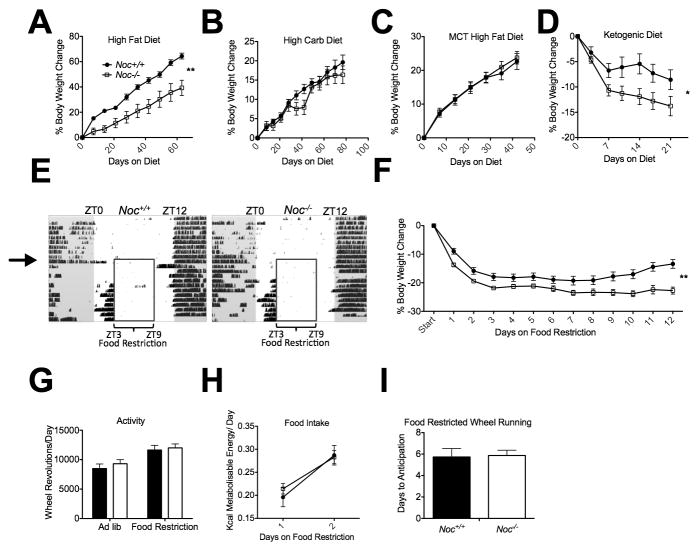
Background: Efficient metabolic function in mammals depends on the circadian clock, which drives temporal regulation of metabolic processes. Nocturnin is a clock-regulated deadenylase that controls its target mRNA expression posttranscriptionally through poly(A) tail removal. Mice lacking nocturnin (Noc(-/-) mice) are resistant to diet-induced obesity and hepatic steatosis yet are not hyperactive or hypophagic.

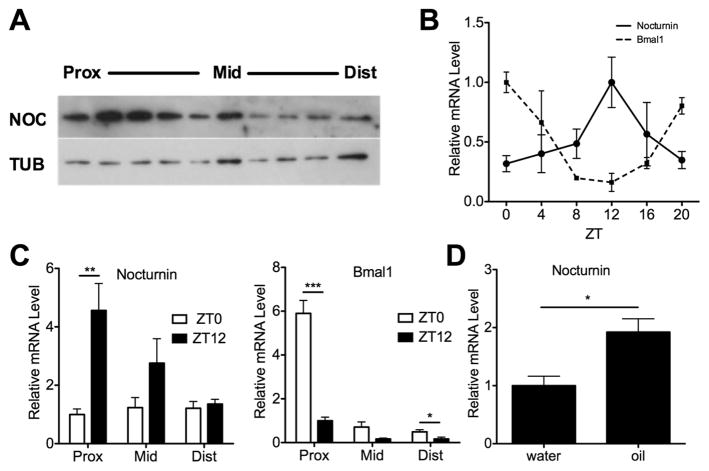
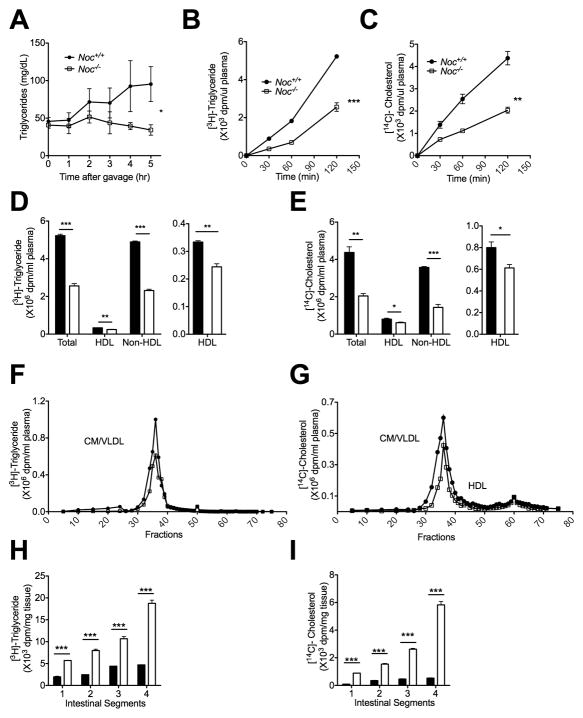
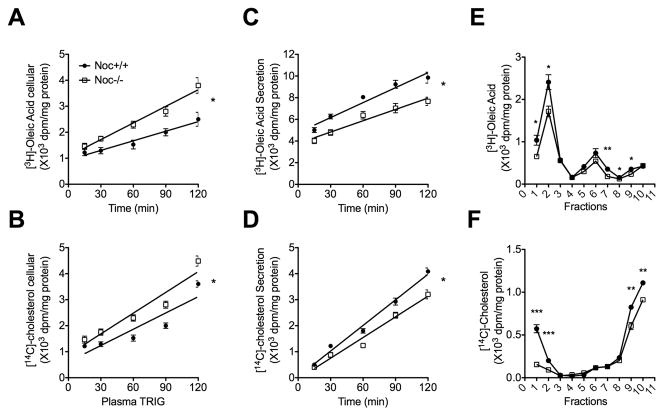
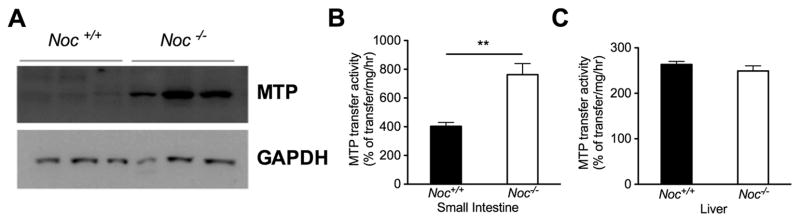
Results: Here we show that nocturnin is expressed rhythmically in the small intestine and is induced by olive oil gavage and that the Noc(-/-) mice have reduced chylomicron transit into the plasma following the ingestion of dietary lipids. Genes involved in triglyceride synthesis and storage and chylomicron formation have altered expression, and large cytoplasmic lipid droplets accumulate in the apical domains of the Noc(-/-) enterocytes. The physiological significance of this deficit in absorption is clear because maintenance of Noc(-/-) mice on diets that challenge the chylomicron synthesis pathway result in significant reductions in body weight, whereas diets that bypass this pathway do not.

Conclusions: Therefore, we propose that nocturnin plays an important role in the trafficking of dietary lipid in the intestinal enterocytes by optimizing efficient absorption of lipids.


Figures

Figure 1
Figure 1. Nocturnin is expressed rhythmically in the small intestine and is induced by lipid feeding
(a) Mouse small intestine was harvested at ZT 12, dissected into 10 equally sized portions, from proximal to distal, and NOCTURNIN (NOC) protein expression was measured by western blot. TUBULIN (TUB) was used as a loading control. Prox, proximal; Mid, middle; and Dist, distal regions of the intestine. (b) Proximal sections of the small intestine (approximately the upper third) were collected from mice at different circadian times throughout the day as shown. Nocturnin and Bmal1 mRNA expression were assessed by quantitative RT-PCR (n=3 per time point, means ± SEM) (c) Small intestines were collected from mice at ZT0 and ZT12 and dissected into 3 equally sized portions called “proximal” (prox), “middle” (mid) and “distal” (dist). Nocturnin and Bmal1 mRNA expression were measured as described in (b). (n=4 per time point, means ± SEM) asterisks denote statistically significant differences in gene expression between sample times: * P < 0.05, ** P < 0.01, ***P < 0.001 by Student’s T-test. (d) A gavage of olive oil or water was administered at ZT 3 followed by isolation of the proximal small intestine 2 hours later at ZT 5. Nocturnin mRNA expression was measured as in (b) (n=5 per treatment, means ± SEM) and asterisks denote statistically significant differences (* P < 0.05) between treatments. The beta-2-microglobin (B2M) mRNA was used for normalization (b–d).
Figure 2
Figure 2. Noc−/− mice have deficits in triglyceride and cholesterol transport into blood
(a) Noc+/+ and Noc−/− mice were given an olive oil gavage and then plasma was collected at various timepoints following the gavage, as shown. Total TG content was measured from each plasma sample. (b and c) Mice were fed radiolabeled TG and cholesterol and plasma was collected at various times post-gavage and assayed for radioactivity. Shown are the plasma levels of [3H]-triglyceride (b) or [14C]-cholesterol (c) after an oral gavage. (d – g) Plasma samples from (b) and (c) were fractionated into total, HDL and non-HDL plasma fractions (d and e) or separated into different lipoprotein density fractions by FPLC (f and g). To the right of each graph, the HDL fractions are replotted with expanded y-axes for better visualization. (h and i) Graphs show the level of [3H]-triglyceride (h) and [14C]-cholesterol (i) that remained within the intestine after an oral gavage. Segment 1 is proximal and Segment 4 is distal part of intestine. All the graphs are means ± SEM, and asterisks denote statistically significant differences between genotypes: * P < 0.05, ** P < 0.01, ***P < 0.001 by linear mixed effects model (a), repeat measures ANOVA (b and c) or Student’s T-test (d, e, h, i). Samples are n=6 per genotype (a) and n=3 for both genotypes per time point (b and c), or pooled (d, e, h, i).
Figure 3
Figure 3. Primary enterocyte cultures from Noc−/− mice exhibit decreased lipoprotein secretion
Primary enterocytes were isolated from Noc+/+ and Noc −/− mice and cultured with radiolabeled oleic acid or cholesterol, washed and chased for 2 hours in the presence of 1.5mM oleic acid-containing micells. (a and b) Shown is intracellular content of [3H]-Oleic acid (a) and [14C]-Cholesterol (b) in primary enterocytes. (c and d) and secretion of [3H]-Oleic acid (c) and [14C]-Cholesterol (d) from primary enterocytes. (e and f) The radioactivity of [3H]-Oleic acid (e) and [14C]-Cholesterol (f) in conditioned culture medium was separated into different lipoprotein density fractions by density gradient ultracentrifugaion. All the graphs are means ± SEM (n=3), and asterisks in (a, b, c, and d) denote statistically significant differences (* P < 0.05) between genotypes by repeat measures ANOVA, and asterisks in (e and f) denote statistically significant differences (* P < 0.05, ** P < 0.01, *** P < 0.001) by Student’s T-test.. Slopes of regression lines are as follows: (a) WT: 0.012 +/− 0.002; KO: 0.021+/− 0.002; (b) WT: 0.021 +/− 0.003; KO: 0.027+/− 0.003; (c) WT: 0.046 +/− 0.004; KO:. 0.034 +/− 0.004; (d) WT: 0.033 +/− 0.001; KO: 0.026 +/− 0.002.
Figure 4
Figure 4. Activity and abundance of MTP protein is significantly upregulated in the small intestine of Noc−/− mice
(a) The proximal portions of small intestines from Noc+/+ and Noc −/− mice were collected at ZT12 after a 24-hr fast. MTP protein levels were measured by western blot. Shown are results from three individual mice for each genotype. (b and c) Extracts from intestine (b) or liver (c) were assayed for MTP activity. All the graphs are means ± SEM. (n=4 for both genotypes). Asterisks denote statistically significant differences (** P < 0.01) between genotypes by Student’s T-test.
Figure 5
Figure 5. Lipid accumulates in larger droplets in the Noc−/− enterocytes
(a) Representative pictures of intestines stained with Oil-Red O (Noc+/+ left, and Noc−/− right) two hours after olive oil gavage (ZT5). Examples from 2 different mice are shown for each genotype. All images were taken at the same magnification and the bar in the upper left panel represents 10 μm. (b) Oil-Red O stained sections were analyzed by counting the number of oil droplets in different size “bins”. Shown is a histogram detailing number and size of lipid droplets stained with Oil-Red O in proximal small intestine (n=7 mice per genotype). The values on the x-axis refer to the largest size oil droplet assigned to that bin (for example, “5” refers to the number of oil droplets between 0–5 microns). (c) Representative TEM images of Noc+/+ (top) and Noc−/− (bottom) in proximal small intestine (n=4 mice per genotype). Samples were taken at ZT14, two hours after an olive oil gavage. Asterisks denote large CLDs. Scale bar represents 5μm.
Figure 6
Figure 6. Noc −/− mice cannot maintain body weight on diets that challenge the lipoprotein secretion pathway
Body weights were recorded from Noc+/+ and Noc −/− mice maintained on (a) a high fat diet (Noc+/+ n=8, Noc−/− n=6), (b) a high carbohydrate diet (Noc+/+ n=14, Noc−/− n=10), (c) a medium-chain triglyceride high fat diet (Noc+/+ n=13, Noc−/− n=19) and (d) a ketogenic diet (Noc+/+ n=14, Noc−/− n=17). Shown are percent body weight change (means +/− SEMs). (e) Representative actograms of continuous running wheel recordings of adult male Noc+/+ (left) or Noc−/− (right) mice. Each horizontal line represents 24 hours and each day is plotted blow the previous day. Mice are individually housed in 12:12 Light-Dark cycle (white and gray background, respectively) with ad lib access to food for 7 days, followed by restriction of food to 6 hours in the middle of the day (insert box). Black hash marks indicate wheel-running behavior. (f) Percent body weight change (means ± SEM) over 12 days of food restriction (Noc+/+ n=29–35, Noc−/− n=31–37 for each time point, Linear Mixed Effect model of repeat measures ANOVA F=8.1, p<0.01 for genotype). (g) Overall activity levels (wheel revolutions/day) before and during food restriction. (h) Energy consumed per day while on food restriction (Noc+/+ n=35, Noc−/− n=37 for each time point). (i) Days to anticipation of food presentation as measured by sustained wheel running under food restriction diet (Noc+/+ n=15, Noc−/− n=15).

Comment in

Similar articles

Cited by

References

    1. Green CB, Takahashi JS, Bass J. The meter of metabolism. Cell. 2008;134:728–742. - PMC - PubMed
    1. Vener KJ, Szabo S, Moore JG. The effect of shift work on gastrointestinal (GI) function: a review. Chronobiologia. 1989;16:421–439. - PubMed
    1. Ribeiro DC, Hampton SM, Morgan L, Deacon S, Arendt J. Altered postprandial hormone and metabolic responses in a simulated shift work environment. The Journal of endocrinology. 1998;158:305–310. - PubMed
    1. Wang Y, Osterbur DL, Megaw PL, Tosini G, Fukuhara C, Green CB, Besharse JC. Rhythmic expression of Nocturnin mRNA in multiple tissues of the mouse. BMC Dev Biol. 2001;1:9. - PMC - PubMed
    1. Baggs JE, Green CB. Nocturnin, a Deadenylase in Xenopus laevis Retina. A Mechanism for Posttranscriptional Control of Circadian-Related mRNA. Curr Biol. 2003;13:189–198. - PubMed

Publication types

MeSH terms