. 2011 Sep 30;412(4):710-22.
doi: 10.1016/j.jmb.2011.07.036. Epub 2011 Jul 29.

The Staphylococcus aureus pathogenicity island 1 protein gp6 functions as an internal scaffold during capsid size determination

Affiliations

The Staphylococcus aureus pathogenicity island 1 protein gp6 functions as an internal scaffold during capsid size determination

Altaira D Dearborn et al. J Mol Biol. .

Abstract

Staphylococcus aureus pathogenicity island 1 (SaPI1) is a mobile genetic element that carries genes for several superantigen toxins. SaPI1 is normally stably integrated into the host genome but can become mobilized by "helper" bacteriophage 80α, leading to the packaging of SaPI1 genomes into phage-like transducing particles that are composed of structural proteins supplied by the helper phage but having smaller capsids. We show that the SaPI1-encoded protein gp6 is necessary for efficient formation of small capsids. The NMR structure of gp6 reveals a dimeric protein with a helix-loop-helix motif similar to that of bacteriophage scaffolding proteins. The gp6 dimer matches internal densities that bridge capsid subunits in cryo-electron microscopy reconstructions of SaPI1 procapsids, suggesting that gp6 acts as an internal scaffolding protein in capsid size determination.


Figures

Figure 1
Figure 1
Gp6 sequence homology. Sequence alignment of SaPI1 gp6, its homologs from several other pathogenicity and resistance islands in S. aureus, S. hominis (ShoPI1) and S. haemolyticus (ShPI2) and the C-terminal 136 residues of 80α gp46. Black boxes indicate identity; open boxes, sequence homology, based on the Risler matrix . (GenBank accession numbers: SaPI1, U93688; SaPI2, EF010993; SaPI3, CP000046; ShoPI1, NZ_ACLP01000007; ShPI2, AP006716; SaRIfusB, AM292600.)
Figure 2
Figure 2
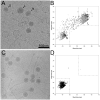
Effect of deletion of gp6. (a) Cryo-electron micrograph of SaPI1 Δorf6 particles. Examples of small (S), large (L) and non-isometric (N) capsids are indicated. (b) Size distribution plot of SaPI1 Δorf6 particles. The short and long axes of each particle (nm) were plotted on the x and y axes, respectively. Gray circles represent empty particles, while black circles represent filled particles. Clusters corresponding to small (S) and large (L) isometric shells are demarcated (dashed lines). (c) Cryo-EM and (d) size distribution plot of SaPI1 wildtype particles. Scale bar, 100 nm.
Figure 3
Figure 3
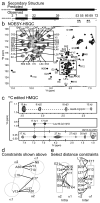
Characterization of gp6. (a) The predicted and observed secondary structure of gp6 are shown, with black boxes representing α-helices. Pertinent residue numbers are indicated. The wavy line represents the disordered C-terminal sequence in the NMR structure. The open triangles indicate predicted tryptic cleavage sites, while filled triangles show sites that were both predicted and found to be cleaved by MS analysis. The numbers in circles indicate the order in which cleavage was detected. (b) 1H-15N HSQC spectrum of gp6, with peaks assigned to residues as labeled. Inset, magnified view of the crowded central region. (c) Three examples of 13C-edited/12C-double half-filtered HMQC-NOESY spectra, showing intermolecular contacts formed by the β, δ1 and γ2 methyl groups of residues A30, L19 and V13, respectively. (d) Schematic diagram of the intermolecular interactions shown in (c). The circles represent the αhelices, viewed from the connecting loop (gray line). (e) Schematic diagram of the intra- (left) and intermolecular (right) interactions used as restraints in the structure calculation. The rectangles represent side views of the α1 and α1 helices. See also Fig. S1.
Figure 4
Figure 4
Structure of gp6. (a) Stereo view of the superposition of 20 top solutions (gray) with the lowest energy structure colored red and blue, by chain. (c) Ribbon representation of the lowest energy solution of the gp6 dimer. Secondary structure elements are labeled, and the 33-residue disordered C-termini are indicated by dotted lines. (c) Stereo view of a detail of the dimer tip, viewed down the axis of the helical bundle. The loop residues (FGLNE) are depicted in ball-and-stick representation, colored by atom type. (d) Ribbon diagram of the bacteriophage φ29 gp7 scaffolding protein (PDB ID 1NO4), colored yellow and green by chain.
Figure 5
Figure 5
The SaPI1 procapsid. (a) Cryo-electron micrograph of SaPI1 procapsids (ST63), showing a typical field of particles used for reconstruction. Scale bar, 100 nm. (b) Outside view of the SaPI1 procapsid in isosurface representation, colored radially from the center (red to blue). The large triangle represents one icosahedral face, with the fivefold, threefold and twofold symmetry axes indicated (pentagons, triangle and ovals, respectively). Subunits A, B, C and D of one asymmetric unit are labeled. (c) Schematic diagram showing the triangular face from (b). The four subunits (A, B, C and D) in one asymmetric unit are colored red, blue, green and yellow, respectively. Type 1 and 2 trimers are indicated by the filled and open triangles, respectively. The large ovals represent the threefold-associated (pink) and fivefold-associated (purple) gp6 dimers on the inside of the shell. (d) Inner surface of procapsid, colored radially from the center (red to blue). A magnified view of a portion of the map is shown on the right. (e) Superposition of a local region of the SaPI1 (solid surface, colored radially from red to blue) and 80α (mesh) procapsid reconstructions. The internal core in 80α is visible (arrow). A fivefold and a threefold symmetry axis are indicated. (f) Fit of the gp6 dimer in the SaPI1 procapsid map (mesh). A difference map between the gp47 model and the map is shown as a transparent solid at a higher cutoff level and clearly shows the wishbone-like structure. The NMR structure of the gp6 dimer is shown in red and blue; the predicted α-helical C-terminal extensions of gp6 are shown in turquoise and brown; Two gp47 N-terminal helices are shown in purple and orange. See also supplementary video.

References

    1. Frost LS, Leplae R, Summers AO, Toussaint A. Mobile genetic elements: the agents of open source evolution. Nat Rev Microbiol. 2005;3:722–732. - PubMed
    1. Ziebuhr W, Ohlsen K, Karch H, Korhonen T, Hacker J. Evolution of bacterial pathogenesis. Cell Mol Life Sci. 1999;56:719–728. - PMC - PubMed
    1. Gordon RJ, Lowy FD. Pathogenesis of methicillin-resistant Staphylococcus aureus infection. Clin Infect Dis. 2008;46:S350–S359. - PMC - PubMed
    1. Diep BA, Gill SR, Chang RF, Phan TH, Chen JH, Davidson MG, Lin F, Lin J, Carleton HA, Mongodin EF, Sensabaugh GF, Perdreau-Remington F. Complete genome sequence of USA300, an epidemic clone of community-acquired meticillin-resistant Staphylococcus aureus. Lancet. 2006;367:731–739. - PubMed
    1. Katayama Y, Ito T, Hiramatsu K. A new class of genetic element, staphylococcus cassette chromosome mec, encodes methicillin resistance in Staphylococcus aureus. Antimicrob Agents Chemother. 2000;44:1549–1555. - PMC - PubMed

Publication types

MeSH terms

Substances

Associated data

LinkOut - more resources