. 2011 Sep;55(1):94-106.
doi: 10.1016/j.ymeth.2011.07.005. Epub 2011 Jul 29.

The Phenix software for automated determination of macromolecular structures

Affiliations

The Phenix software for automated determination of macromolecular structures

Paul D Adams et al. Methods. 2011 Sep.

Abstract

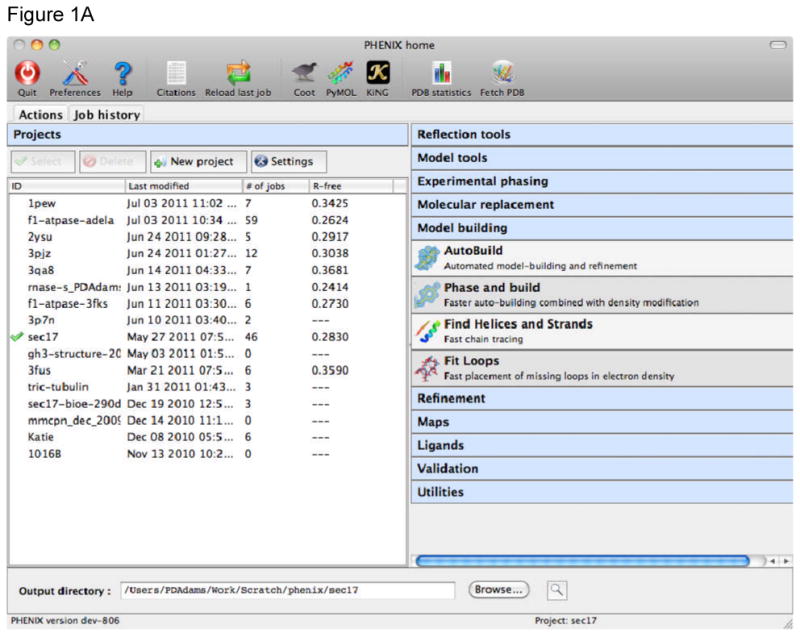
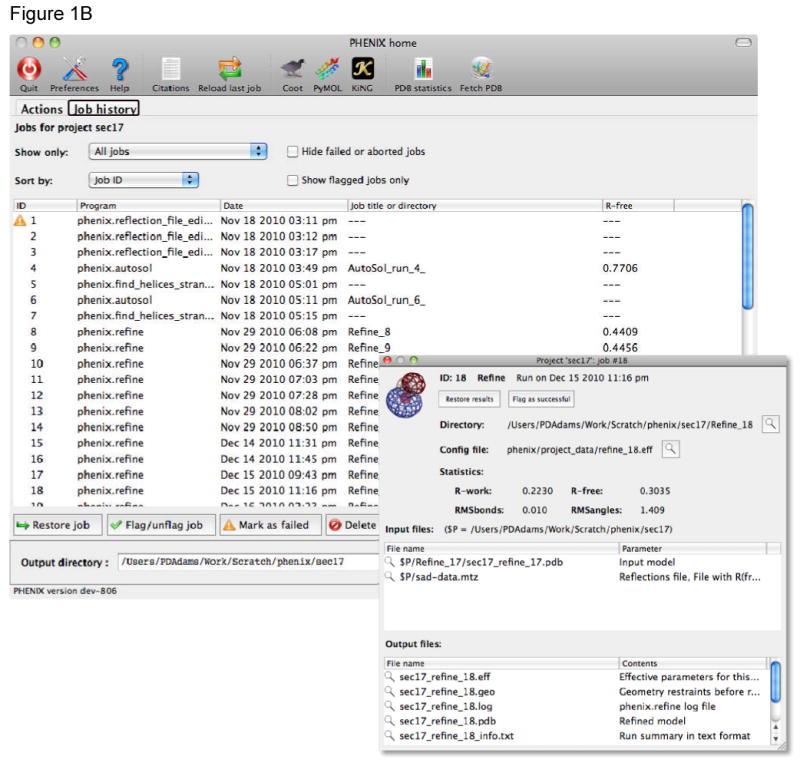
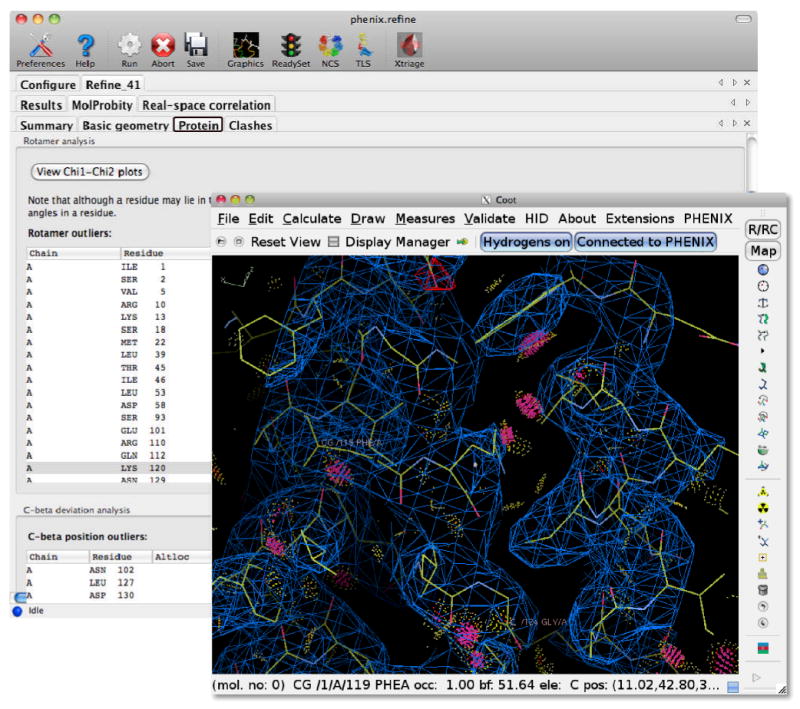
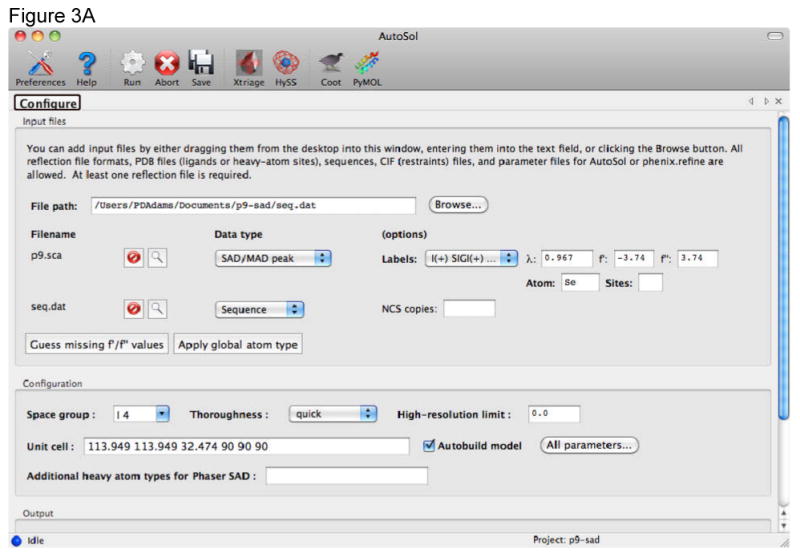
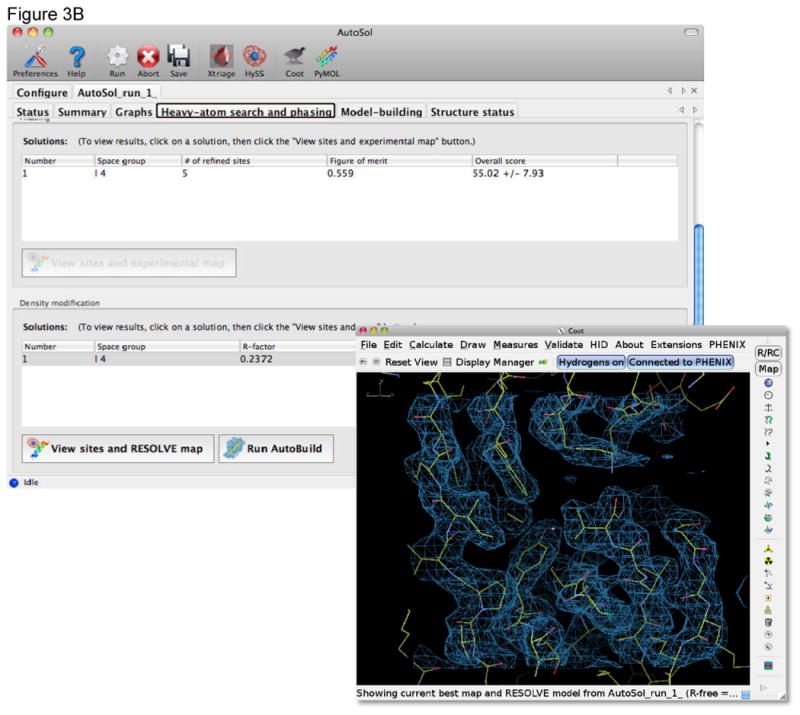
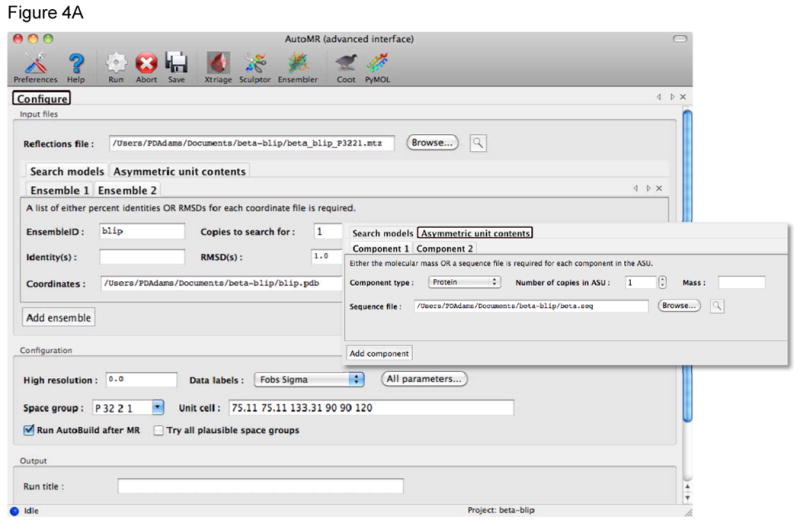
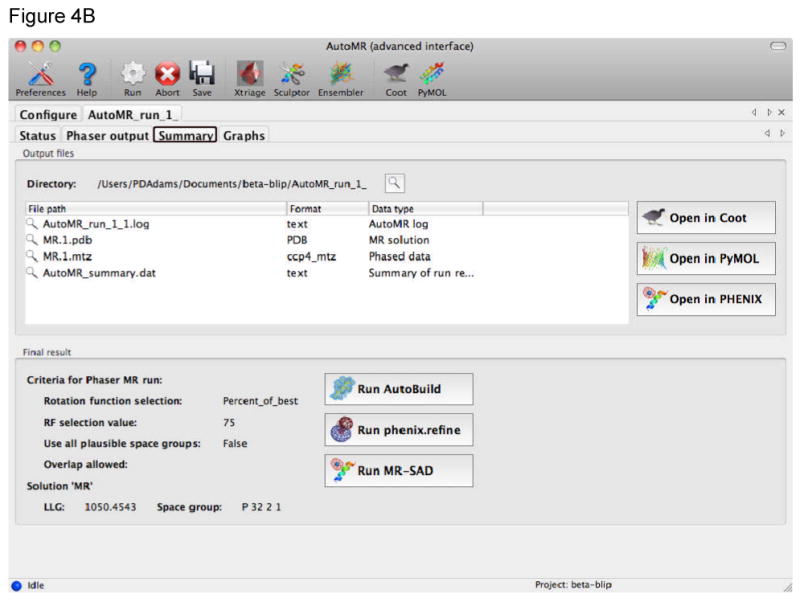
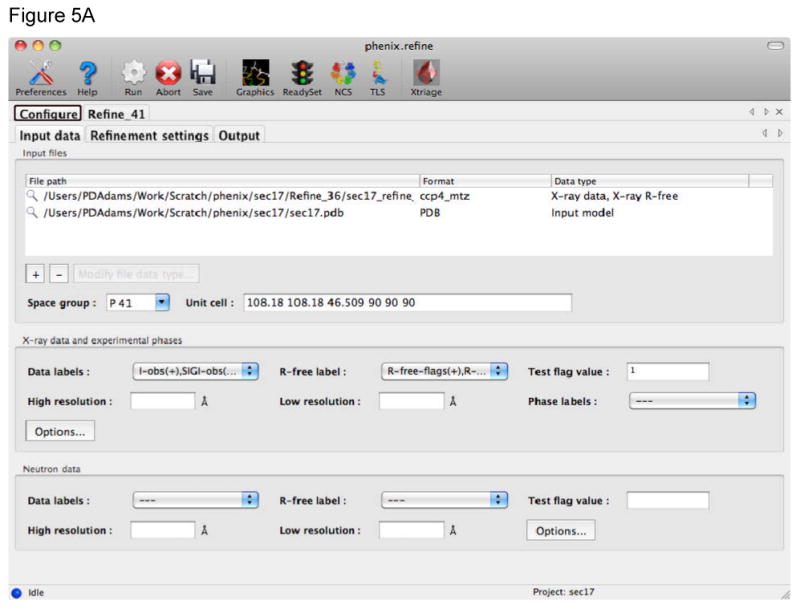
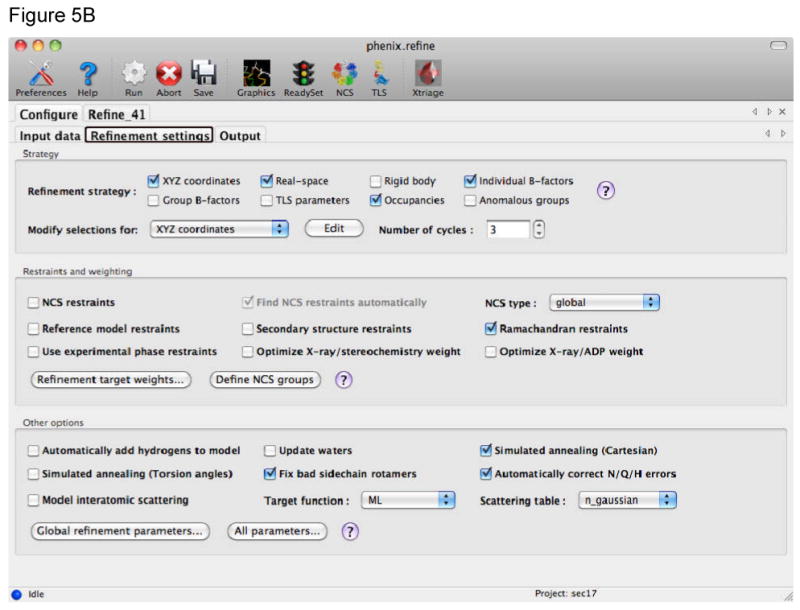
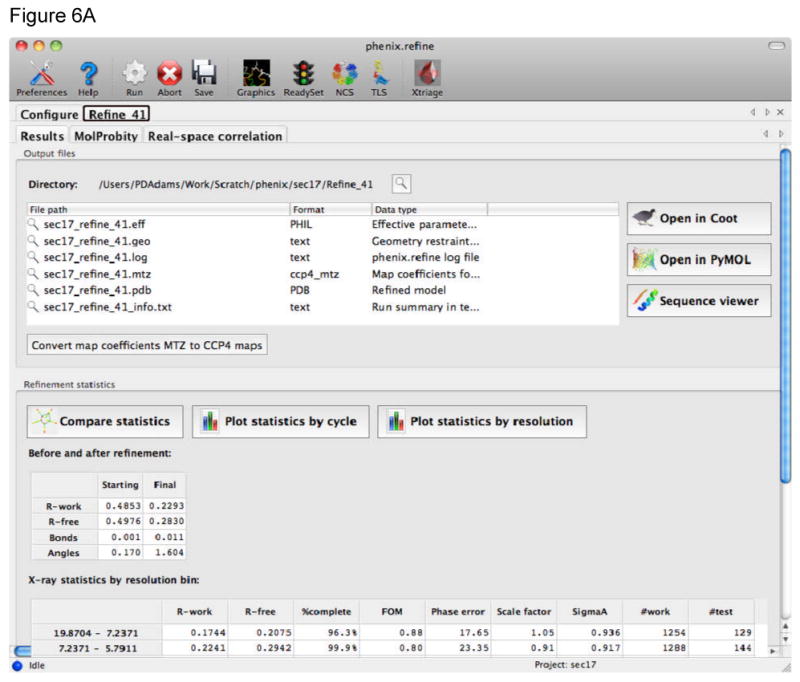
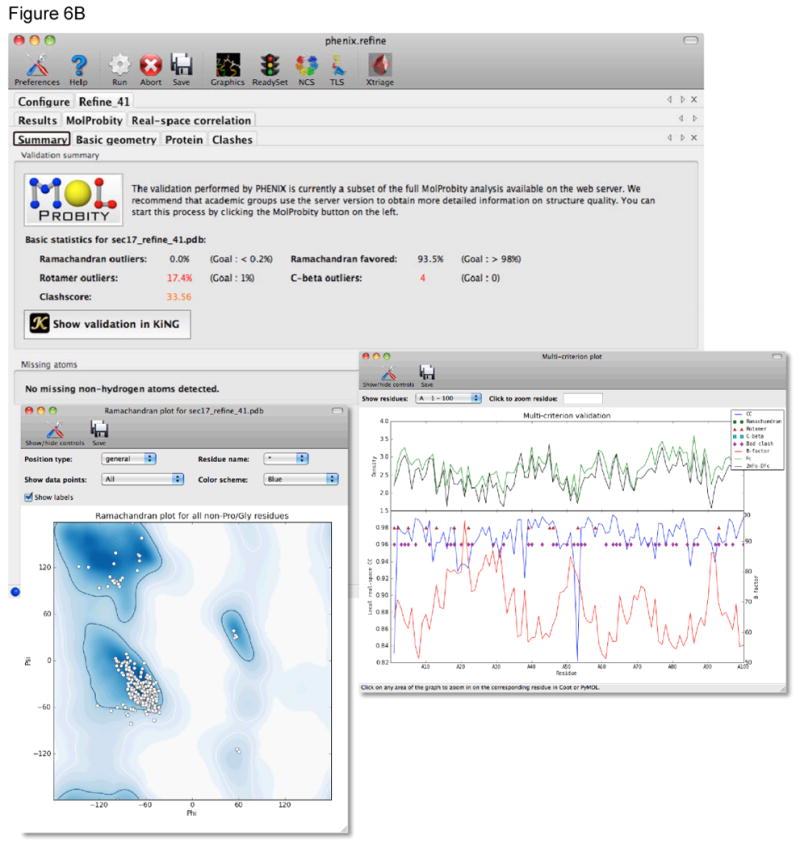
X-ray crystallography is a critical tool in the study of biological systems. It is able to provide information that has been a prerequisite to understanding the fundamentals of life. It is also a method that is central to the development of new therapeutics for human disease. Significant time and effort are required to determine and optimize many macromolecular structures because of the need for manual interpretation of complex numerical data, often using many different software packages, and the repeated use of interactive three-dimensional graphics. The Phenix software package has been developed to provide a comprehensive system for macromolecular crystallographic structure solution with an emphasis on automation. This has required the development of new algorithms that minimize or eliminate subjective input in favor of built-in expert-systems knowledge, the automation of procedures that are traditionally performed by hand, and the development of a computational framework that allows a tight integration between the algorithms. The application of automated methods is particularly appropriate in the field of structural proteomics, where high throughput is desired. Features in Phenix for the automation of experimental phasing with subsequent model building, molecular replacement, structure refinement and validation are described and examples given of running Phenix from both the command line and graphical user interface.


Figures

Figure 1
Figure 1
A) The main Phenix graphical user interface (GUI) window. User projects are shown on the left of the window, with the current project shown with a green check mark. Projects can be created, selected and deleted. The procedures that can be applied to the data within a project are shown on the right of the main window. Each blue banner can be folded or unfolded with a mouse click, revealing the available programs (those for model building are shown here). A number of other tools are available through the icons at the top of the window, or from pull down menus. B) The Job History tab is used to provide a list of the jobs run within a project. The job name, date of execution, directory containing the results, and free R-factor at the end of the job (if applicable) are recorded. Details for a job can be viewed with the Show details button (details window shown as inset).
Figure 1
Figure 1
A) The main Phenix graphical user interface (GUI) window. User projects are shown on the left of the window, with the current project shown with a green check mark. Projects can be created, selected and deleted. The procedures that can be applied to the data within a project are shown on the right of the main window. Each blue banner can be folded or unfolded with a mouse click, revealing the available programs (those for model building are shown here). A number of other tools are available through the icons at the top of the window, or from pull down menus. B) The Job History tab is used to provide a list of the jobs run within a project. The job name, date of execution, directory containing the results, and free R-factor at the end of the job (if applicable) are recorded. Details for a job can be viewed with the Show details button (details window shown as inset).
Figure 2
Figure 2
Integration of refinement and validation with model rebuilding in Coot[31]. After refinement or structure validation is finished the current model and electron density maps are displayed in Coot, information being transferred between Phenix and Coot using Python and the XML-RPC communication protocol. The validation lists in Phenix are interactive, for example, clicking on a rotamer outlier in the rotamer list will re-centre the Coot display to that rotamer. Other validation information, such as the contacts between atoms calculated with the Probe program, are also automatically displayed in Coot.
Figure 3
Figure 3
Automated structure solution and initial model building with the Autosol wizard in Phenix. A) The Configuration tab provides dynamic input fields for diffraction data and the sequence of the molecules in the crystal. The type of the data set can be set using pull down menus. For a SAD experiment it is typically sufficient to provide the anomalous data set, the wavelength at which it was collected, the anomalous scatterer type and the sequence of the molecule (protein or nucleic acid). Values for f′ and f″ can be calculated by the GUI using tables internal to Phenix. In most cases the full resolution of the data is used and automated initial model building performed. B) As the job is running a number of new tabs are generated providing information about the run. The Summary tab provides access to the files produced during heavy atom location, phasing, density modification and model building. The Heavy-atom search and phasing tab scores for each solution pursued by the wizard and buttons to allow easy viewing of these solutions in Coot or PyMOL[32].
Figure 3
Figure 3
Automated structure solution and initial model building with the Autosol wizard in Phenix. A) The Configuration tab provides dynamic input fields for diffraction data and the sequence of the molecules in the crystal. The type of the data set can be set using pull down menus. For a SAD experiment it is typically sufficient to provide the anomalous data set, the wavelength at which it was collected, the anomalous scatterer type and the sequence of the molecule (protein or nucleic acid). Values for f′ and f″ can be calculated by the GUI using tables internal to Phenix. In most cases the full resolution of the data is used and automated initial model building performed. B) As the job is running a number of new tabs are generated providing information about the run. The Summary tab provides access to the files produced during heavy atom location, phasing, density modification and model building. The Heavy-atom search and phasing tab scores for each solution pursued by the wizard and buttons to allow easy viewing of these solutions in Coot or PyMOL[32].
Figure 4
Figure 4
Automated molecular replacement with the AutoMR wizard in Phenix. A) The AutoMR wizard has a simple and an advanced interface. The simple interface is designed for cases where there is only one molecular component in the asymmetric unit (ASU) – multiple copies of that component are supported. The advanced interface is provided for more complex cases with multiple components. In this example there are two components that form a complex in the ASU. It is necessary to define the search model(s), which will be placed in the crystal, and the contents of the ASU (shown in the inset). The latter is best achieved by providing sequence files, as these can then also be used for automated model building subsequent to the molecular replacement. B) During the run new tabs are generated to show the progress of the molecular replacement. At the end of the run the Summary tab provides a list of the files generated, links for easy viewing of the model and current electron density map in Coot or PyMOL, and links to running the next step in Phenix: automated model (re)building with the AutoBuild wizard, structure refinement with phenix.refine, or combined MR-SAD phasing in Phaser.
Figure 4
Figure 4
Automated molecular replacement with the AutoMR wizard in Phenix. A) The AutoMR wizard has a simple and an advanced interface. The simple interface is designed for cases where there is only one molecular component in the asymmetric unit (ASU) – multiple copies of that component are supported. The advanced interface is provided for more complex cases with multiple components. In this example there are two components that form a complex in the ASU. It is necessary to define the search model(s), which will be placed in the crystal, and the contents of the ASU (shown in the inset). The latter is best achieved by providing sequence files, as these can then also be used for automated model building subsequent to the molecular replacement. B) During the run new tabs are generated to show the progress of the molecular replacement. At the end of the run the Summary tab provides a list of the files generated, links for easy viewing of the model and current electron density map in Coot or PyMOL, and links to running the next step in Phenix: automated model (re)building with the AutoBuild wizard, structure refinement with phenix.refine, or combined MR-SAD phasing in Phaser.
Figure 5
Figure 5
The phenix.refine GUI uses tabs to collect the different kinds of information required. A) The Input data tab provides fields for files, such as structure factors, coordinates, and additional geometric restraints. The type of file is detected automatically, information extracted, and other fields in the GUI automatically completed when possible (such as space group and unit cell information read from a structure factor file). B) The Refinement settings tab provides fields to control the refinement job. This includes the strategy for the refinement, which is generally the parameterization of the model, use of additional restraints, and other options that influence the refinement. To use simulated annealing in refinement either Cartesian or Torsion angle are selected by use of the check boxes in this tab. To use rigid body refinement the Rigid body check box is selected and the appropriate rigid bodies identified using textual atom selections or graphically using a selection GUI. The same procedure applies to the use of TLS refinement.
Figure 5
Figure 5
The phenix.refine GUI uses tabs to collect the different kinds of information required. A) The Input data tab provides fields for files, such as structure factors, coordinates, and additional geometric restraints. The type of file is detected automatically, information extracted, and other fields in the GUI automatically completed when possible (such as space group and unit cell information read from a structure factor file). B) The Refinement settings tab provides fields to control the refinement job. This includes the strategy for the refinement, which is generally the parameterization of the model, use of additional restraints, and other options that influence the refinement. To use simulated annealing in refinement either Cartesian or Torsion angle are selected by use of the check boxes in this tab. To use rigid body refinement the Rigid body check box is selected and the appropriate rigid bodies identified using textual atom selections or graphically using a selection GUI. The same procedure applies to the use of TLS refinement.
Figure 6
Figure 6
At the end of a run of phenix.refine a new tab is generated with the results. A) The main Results tab gives a listing of the files generated, overall quality statistics and statistics by resolution shell. The current model and electron density maps are readily viewed by clicking on the Open in Coot or Open in PyMOL buttons. B) The MolProbity tab provides a summary of the geometric validation criteria with details about deviations from restraint library, Protein, RNA, and atomic clashes in separate tabs. The Protein tab for example lists Ramachandran, sidechain rotamer, and Cβ outliers. Plots of Ramachandran and rotamer χ12 distributions are readily viewed. The Summary tab also provides a link to view the validation results in the KiNG program. The Real-space correlation tab provides information about how well the residues/atoms in the model fit the local electron density. This information is shown in the multi-criterion plot that also displays geometric outliers.
Figure 6
Figure 6
At the end of a run of phenix.refine a new tab is generated with the results. A) The main Results tab gives a listing of the files generated, overall quality statistics and statistics by resolution shell. The current model and electron density maps are readily viewed by clicking on the Open in Coot or Open in PyMOL buttons. B) The MolProbity tab provides a summary of the geometric validation criteria with details about deviations from restraint library, Protein, RNA, and atomic clashes in separate tabs. The Protein tab for example lists Ramachandran, sidechain rotamer, and Cβ outliers. Plots of Ramachandran and rotamer χ12 distributions are readily viewed. The Summary tab also provides a link to view the validation results in the KiNG program. The Real-space correlation tab provides information about how well the residues/atoms in the model fit the local electron density. This information is shown in the multi-criterion plot that also displays geometric outliers.

References

    1. Sheldrick GM. A short history of SHELX. Acta crystallographica Section A, Foundations of crystallography. 2008;64(Pt 1):112–22. - PubMed
    1. Allen FH, Kennard O, Taylor R. Systematic Analysis of Structural Data as a Research Technique in Organic Chemistry. Acc Chem Res. 1983;16:146–153.
    1. Weeks CM, et al. Automatic solution of heavy-atom substructures. Methods Enzymol. 2003;374:37–83. - PubMed
    1. Terwilliger TC, Berendzen J. Automated MAD and MIR structure solution. Acta Crystallogr D Biol Crystallogr. 1999;55(Pt 4):849–61. - PMC - PubMed
    1. Fortelle Edl, Bricogne G. Methods in Enzymology. Academic Press; San Diego: 1997. Maximum-Likelihood Heavy-Atom Parameter Refinement for Multiple Isomorphous Replacement and Multiwavelength Anomalous Diffraction Methods; pp. 472–494. - PubMed

Publication types

LinkOut - more resources