. 2011 Nov;96(1-4):54-62.
doi: 10.1016/j.prostaglandins.2011.07.005. Epub 2011 Jul 27.

Crosstalk between EET and HO-1 downregulates Bach1 and adipogenic marker expression in mesenchymal stem cell derived adipocytes

Affiliations

Crosstalk between EET and HO-1 downregulates Bach1 and adipogenic marker expression in mesenchymal stem cell derived adipocytes

Luca Vanella et al. Prostaglandins Other Lipid Mediat. 2011 Nov.

Abstract

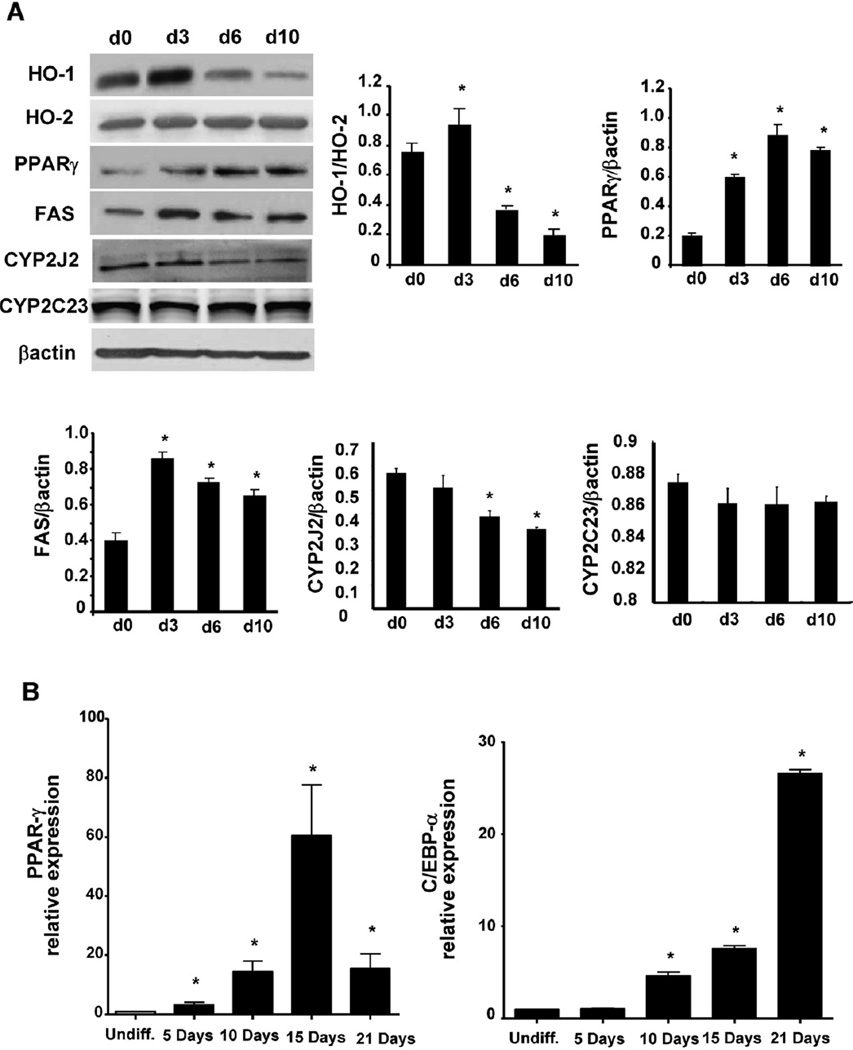
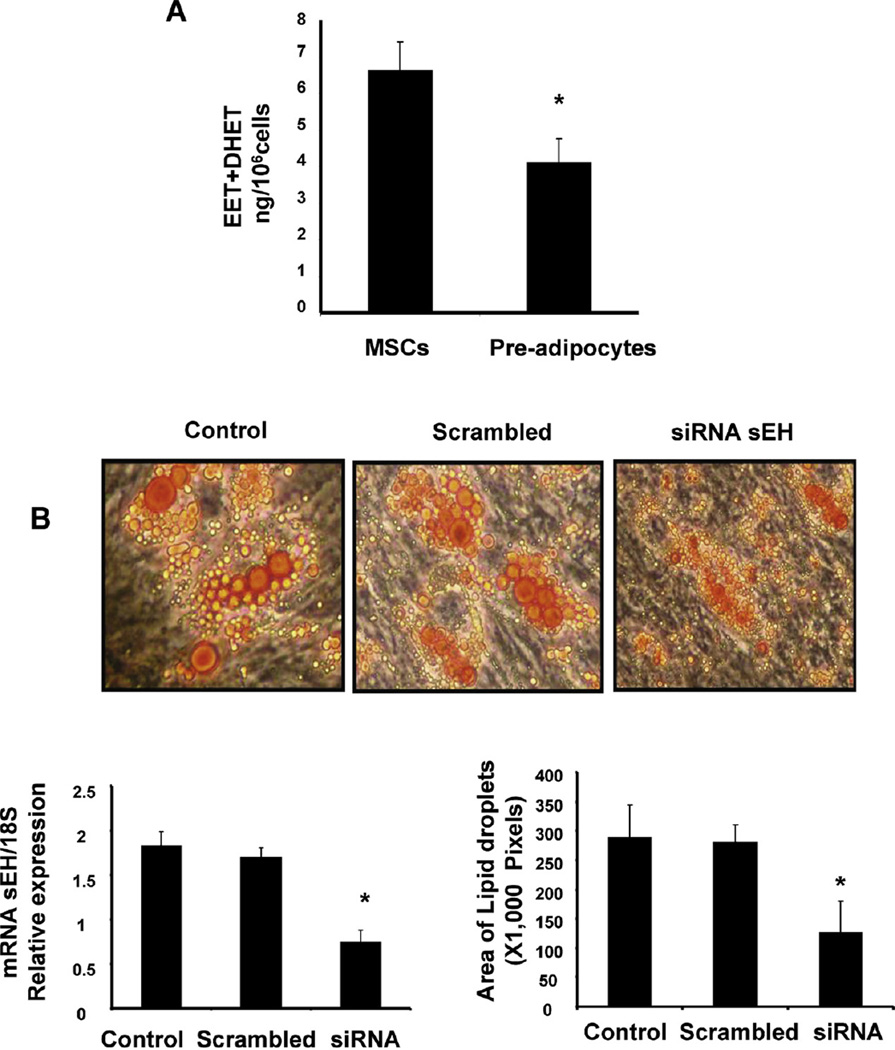
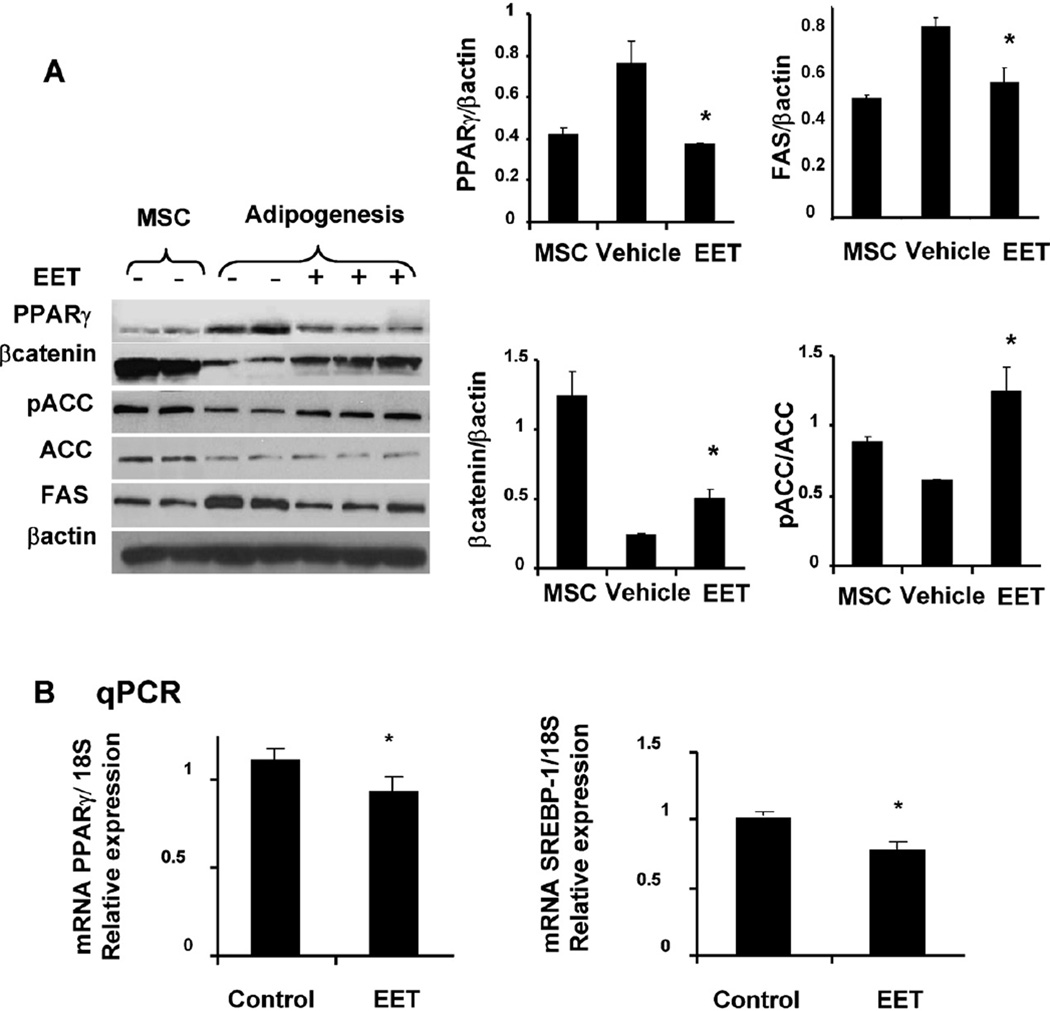
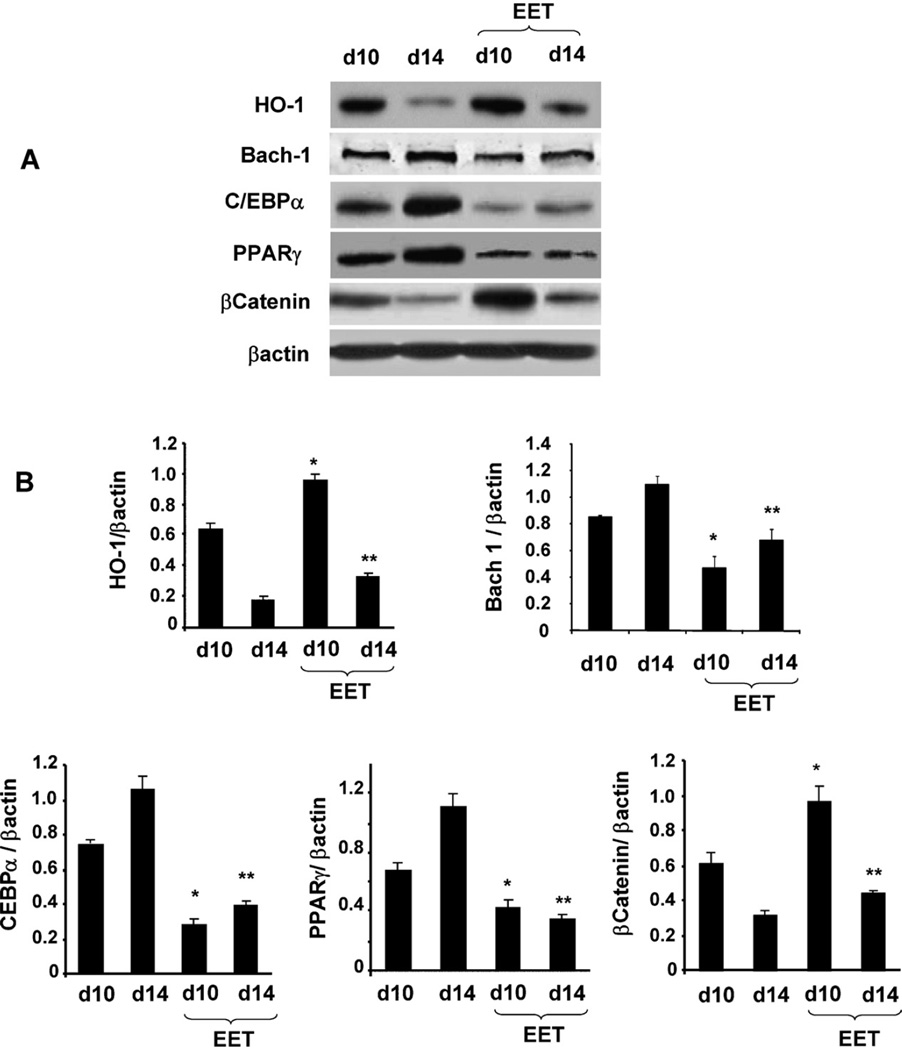
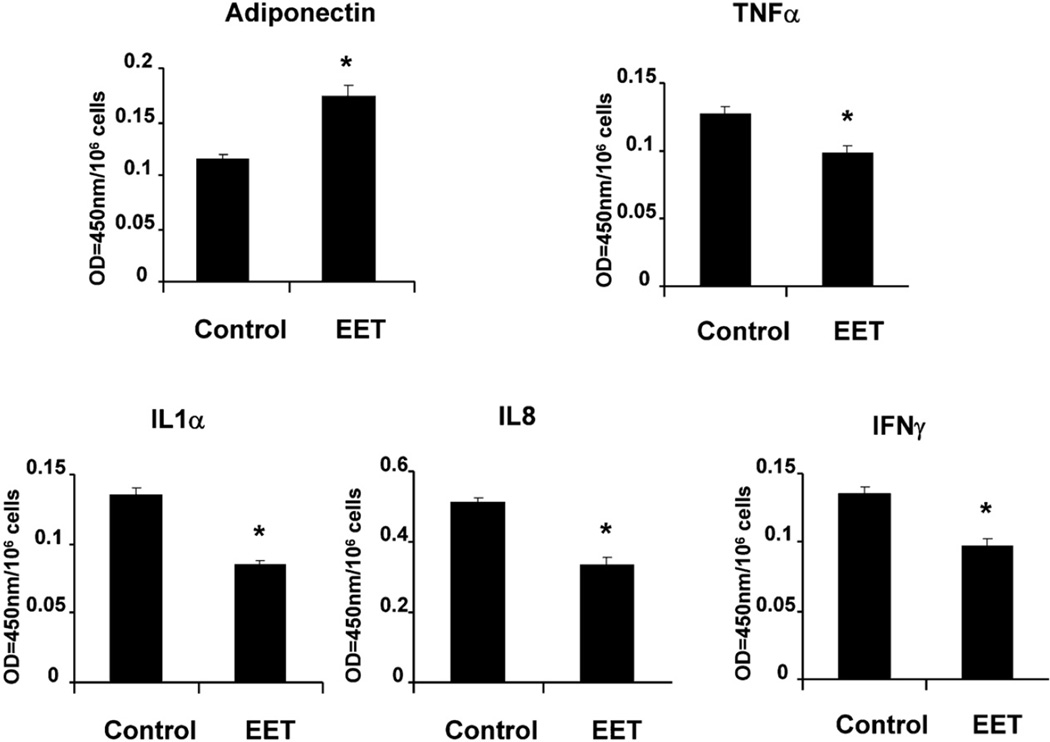
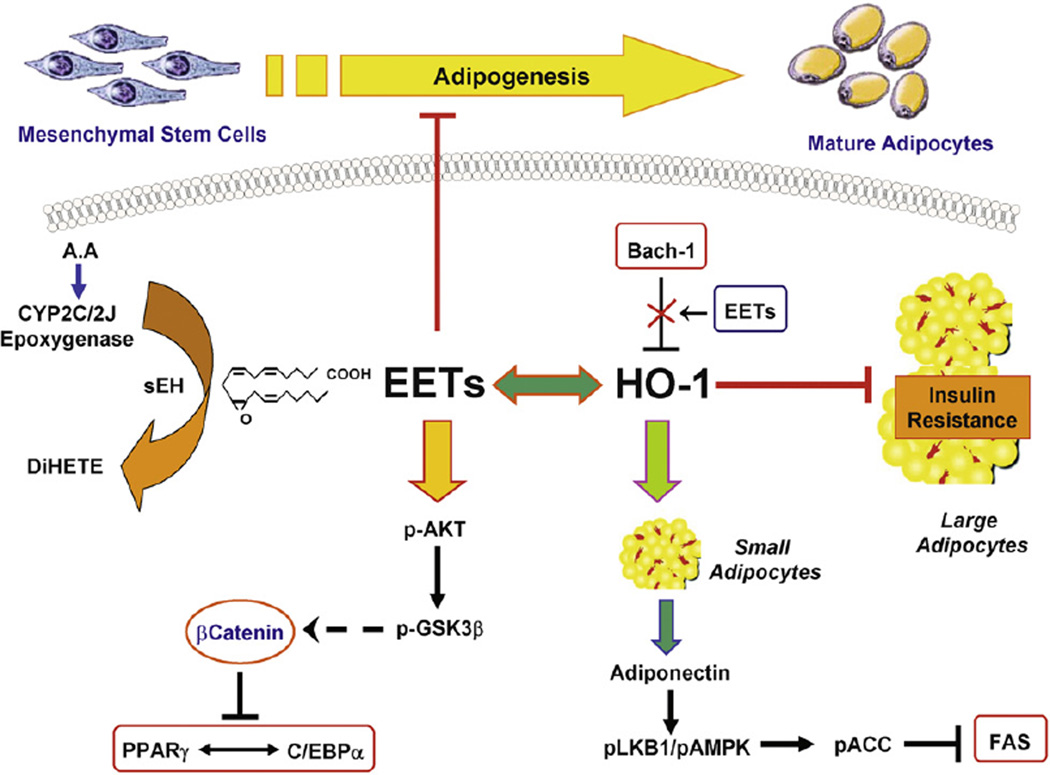
Epoxygenase activity and synthesis of epoxyeicosatrienoic acids (EETs) have emerged as important modulators of obesity and diabetes. We examined the effect of the EET-agonist 12-(3-hexylureido)dodec-8(2) enoic acid on mesenchymal stem cell (MSC) derived adipocytes proliferation and differentiation. MSCs expressed substantial levels of EETs and inhibition of soluble epoxide hydrolase (sEH) increased the level of EETs and decreased adipogenesis. EET agonist treatment increased HO-1 expression by inhibiting a negative regulator of HO-1 expression, Bach-1. EET treatment also increased βcatenin and pACC levels while decreasing PPARγ C/EBPα and fatty acid synthase levels. These changes were manifested by a decrease in the number of large inflammatory adipocytes, TNFα, IFNγ and IL-1α, but an increase in small adipocytes and in adiponectin levels. In summary, EET agonist treatment inhibits adipogenesis and decreases the levels of inflammatory cytokines suggesting the potential action of EETs as intracellular lipid signaling modulators of adipogenesis and adiponectin.


Figures

Fig. 1
Fig. 1
HO-1, PPARγ, FAS and CYP2J2, expression during adipogenesis in MSCs. (A) Expression of HO-1, HO-2, PPARγ, FAS, CYP2J2 and CYP2C in MSCs derived adipocytes on days 0, 3, 6 and 10 were measured by western blot (*p < 0.05 versus day 3, 6 and 10). (B) Expression of mRNA of PPARγ and C/EBPα with time of exposure, day 5, 10, 15 and 21. The results are 3 independent of experiments (*p < 0.05 versus undifferentiated cells).
Fig. 2
Fig. 2
(A). The total level of EET-DHET is significantly decreased in pre-adipocytes (*p < 0.05 versus undifferentiated cells). (B) siRNA-mediated decrease in sEH diminishes mRNA levels and decreased lipid droplet at 10 days of MSC-derived adipocytes differentiation cells transfected with siRNA for every 4 days. Data are expressed as mean ± SE (2B, left panel *p<0.01; 2B, right panel *p<0.05 vs siRNA scrambled or control treated n = 5).
Fig. 3
Fig. 3
Effect of EET-agonist on the levels of PPARγ, FAS, Wnt/β-catenin and pACC. (A) hMSCs-derived adipocytes expressed elevated levels of PPARγ and FAS. Western blots showed that EET-agonist sustained decrease in PPARγ and FAS and simultaneous decrease in β-catenin and pACC. (B) Densitometric evaluations of protein were obtained from three different experiments. Data are expressed as mean ± SE (*p < 0.05 versus untreated 2 days MSCs-derived adipocyte growth). (C) adipogenic markers including PPARγ and SREBP-1 mRNA expression analyzed by quantitative PCR in 10 days culture treated and untreated with EET-agonist. Results for each condition are expressed as mean ± SE (n = 6, *p < 0.05 versus EET-agonist treated).
Fig. 4
Fig. 4
(A) Effect of EET-agonist on HO-1, Bach1 and adipogenic signaling. Western blots and densitometer analysis of C/EBPα, β-catenin, PPARγ Bach1 and HO-1 at d10 and 14 days in presence or absence of EET-agonist treatment. (B) Bars represent the mean ± SEM of four independent experiments (*p < 0.05 versus at d10 + EET-agonst, **p < 0.01 versus at 14 + EET-agonst days).
Fig. 5
Fig. 5
Effect of EET-agonist on inflammatory cytokines levels in control and treated EET-agonist. EET-agonist was added every 2 days for 2 weeks, and cultured media samples were obtained immediately before the media was changed. The results are expressed as values at OD = 450 nm of cultured media. Results are calculated as pg/ml of cultured media for TNF-α, IFNγ, IL-1α, IL-8 and adiponectin (*p < 0.05 versus treated EET-agonist). Each cytokine value was normalized by cell number (values at OD = 450 nm/1000,000 cells ratio).
Fig. 6
Fig. 6
Proposed mechanism for the EET agonist-mediated suppression of MSCs-derived adipocyte differentiation and lipid accumulation. EET agonist-induced HO-1 expression, decreased superoxide inflammatory condition and activated pACC and Wnt/βcatenin leading to a decrease in adipogenic markers.

Similar articles

Cited by

References

    1. Abraham NG, Kappas A. Pharmacological. clinical aspects of heme oxygenase. Pharmacol Rev. 2008;60:79–127. - PubMed
    1. Barbagallo I, Vanella A, Peterson S, et al. Overexpression of heme oxygenase-1 increases human osteoblast stem cell differentiation. J Bone Miner Metab. 2010;28:276–288. - PMC - PubMed
    1. Vanella L, Kim DH, Asprinio D, et al. HO-1 expression increases mesenchymal stem cell-derived osteoblasts but decreases adipocyte lineage. Bone. 2010;46:236–243. - PMC - PubMed
    1. Abraham NG. Molecular regulation—biological role of heme in hematopoiesis. Blood Rev. 1991;5:19–28. - PubMed
    1. Chertkov JL, Jiang S, Lutton JD, Levere RD, Abraham NG. Hemin stimulation of hemopoiesis in murine long-term bone marrow culture. Exp Hematol. 1991;19:905–909. - PubMed

Publication types

MeSH terms