. 2011 Oct 13;118(15):4179-87.
doi: 10.1182/blood-2010-12-325373. Epub 2011 Aug 5.

Bcr-abl signals to desensitize chronic myeloid leukemia cells to IFNα via accelerating the degradation of its receptor

Affiliations

Bcr-abl signals to desensitize chronic myeloid leukemia cells to IFNα via accelerating the degradation of its receptor

Sabyasachi Bhattacharya et al. Blood. .

Abstract

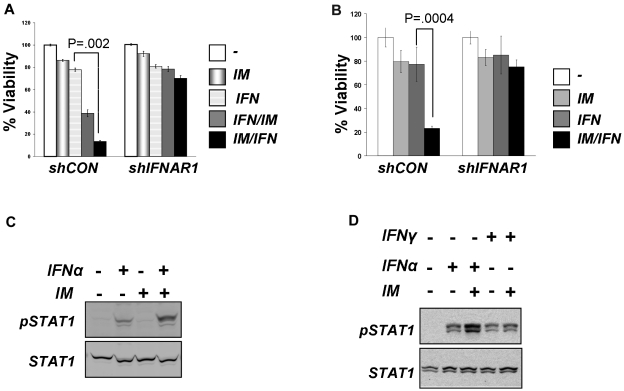
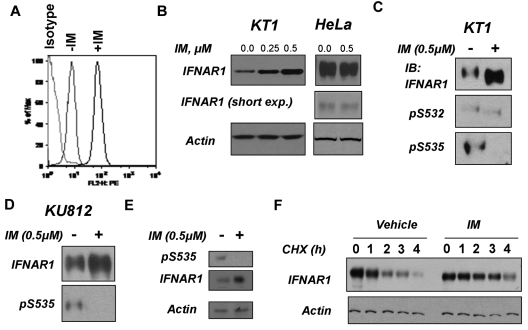
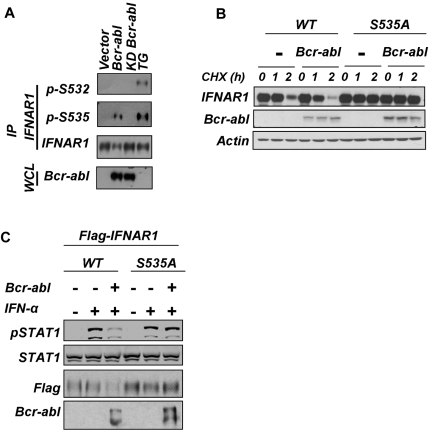
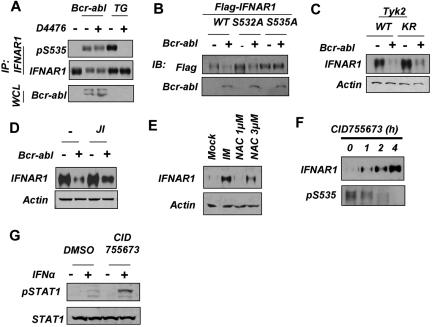
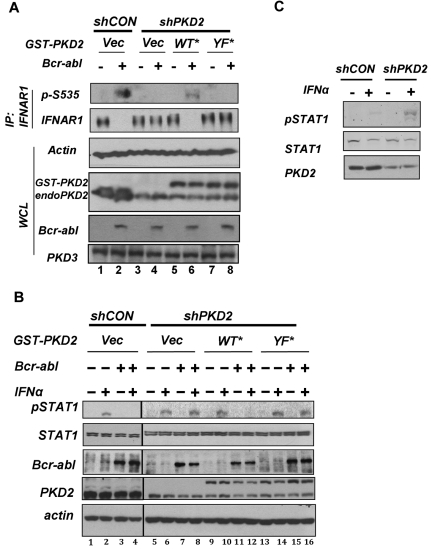
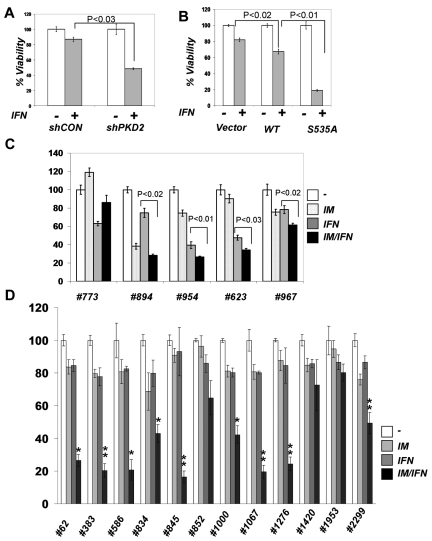
Constitutive activity of Bcr-abl fusion protein kinase causes chronic myeloid leukemia (CML). Inhibitors of Bcr-abl such as imatinib mesylate have replaced the cytokine IFNα as the primary treatment for the management of patients with this malignancy. We found that pretreatment of CML cells with imatinib mesylate augments the antigrowth effects of IFNα. Furthermore, introduction of Bcr-abl into non-CML cells inhibits the cellular responses to IFNα. This inhibition is mediated via a mechanism that involves activation of protein kinase D2. The latter promotes an accelerated phosphorylation-dependent degradation of the interferon-α/β receptor 1 chain of the type I interferon receptor, leading to attenuation of IFNα signaling. We discuss the relationship between Bcr-abl activity and IFNα signaling as a molecular basis of the combination of inhibitors of Bcr-abl and IFNα for CML treatment.


Figures

Figure 1
Figure 1
Inhibition of Bcr-abl activity in CML cells augments cellular responses to IFNα. (A) Viability of KT1 cells that received indicated shRNA and were treated with IM (0.5μM for 8 hours), IFNα (250 IU/mL for 8 hours), or a combination (4 hours + 4 hours) of the 2 as indicated. (B) Viability of KU812 cells that received indicated shRNA and were treated as described in panel A. (C) KT1 cells were pretreated with IM (0.5μM) for 8 hours and then treated with IFNα (250 IU/mL) for 30 minutes. Activation and total levels of STAT1 was analyzed in whole cell lysates by immunoblotting using the indicated antibodies. (D) KT1 cells were pretreated with IM (0.5μM) for 8 hours and then treated with IFNα (250 IU/mL) or IFNγ (50 IU/mL) for 30 minutes. Activation and total levels of STAT1 was analyzed in whole cell lysates by immunoblotting using the indicated antibodies.
Figure 2
Figure 2
Inhibition of Bcr-abl activity in CML cells stabilizes and up-regulates IFNAR1. (A) Cell surface levels of IFNAR1 in KT1 cells treated as indicated were analyzed by flow cytometry using anti-IFNAR1 AA3 antibody or isotype control antibody. (B) Total levels of IFNAR1 and β-actin in KT1 or HeLa cells treated with indicated doses of IM for 8 hours were analyzed by immunoblotting. Short exposure for IFNAR1 blot in HeLa cells also is provided. (C-D) KT1 or KU812 CML cells were incubated with IM (0.5μM) for 8 hours and harvested. Phosphorylation and total levels of IFNAR1 were analyzed by IFNAR1 immunoprecipitation (using anti-IFNAR1 EA12 antibody) followed by immunoblotting using anti–phospho-S535 antibody or anti-IFNAR1 GB8 antibody (as indicated). (E) Primary CML cells from a patient sample (623) were incubated with IM (0.5μM) for 8 hours and harvested. Phosphorylation and total levels of IFNAR1 were analyzed by IFNAR1 immunoprecipitation (using anti-IFNAR1 EA12 antibody) followed by immunoblotting using anti–phospho-S535 antibody or anti-IFNAR1 GB8 antibody (as indicated). Supernatants of the immunoprecipitation reactions were immunoblotted for β-actin to determine loading. (F) KT1 cells pretreated with IM (0.5μM) or vehicle for 8 hours were subjected to treatment with CHX (10μg/mL) for the indicated time points. Endogenous IFNAR1 was immunoprecipitated and levels of IFNAR1 were determined by immunoblotting. Amount of lysates was normalized to achieve comparable levels of IFNAR1 at time point 0. Levels of β-actin in reaction supernatants also were analyzed.
Figure 3
Figure 3
Expression of Bcr-abl signals to promote degradation and down-regulation of IFNAR1 and to attenuate IFNα signaling. (A) HeLa cells were either transfected with plasmids expressing Bcr-abl (wild type or kinase dead [KD]) or treated with TG (1μM for 30 minutes) and harvested. Phosphorylation and total levels of endogenous IFNAR1 (in IFNAR1 immunoprecipitates) or of expressed Bcr-abl (in whole cell lysates [WCL]) were determined by immunoblotting using the indicated antibodies. (B) HeLa cells expressing (or not) Bcr-abl and either FLAG-IFNAR1 or FLAG-IFNAR1S535A as indicated were treated with CHX (10 μg/mL) for the indicated time points. Immunoblotting analyses of the levels of Flag-IFNAR1 Bcr-abl and β-actin are depicted. (C) HeLa cells transfected with plasmids for expression of Bcr-abl and FLAG-tagged IFNAR1 (wild type or the phosphorylation-deficient mutant S535A) were treated or not with IFNα (250 IU/mL) as indicated. STAT1 phosphorylation and levels as well as the levels of FLAG-IFNAR1 and Bcr-abl were analyzed by immunoblotting using indicated antibodies.
Figure 4
Figure 4
Down-regulation of IFNAR1 in cells that express Bcr-abl does not require CK1 or priming phosphorylation of IFNAR1. (A) HeLa cells transfected with Bcr-abl or treated with TG (1μM for 30 minutes) also were treated with CK1 inhibitor D4476 (400nM) and harvested. Phosphorylation and levels of endogenous IFNAR1 and expression of Bcr-abl was analyzed as described in Figure 3. (B) HeLa cells expressing FLAG-tagged IFNAR1 (wild type or IFNAR1S532A or IFNAR1S535A mutants) were cotransfected with either empty vector or vector expressing Bcr-abl. Total levels of FLAG-IFNAR1 and Bcr-abl were assessed by immunoblotting using the indicated antibodies. (C) Human fibrosarcoma 11.1-derivative cells expressing either wild-type TYK2 (WT) or kinase dead TYK2 (KR) were transfected with empty vector or vector expressing Bcr-abl. IFNAR1 was immunoprecipitated, and total IFNAR1 was assessed by immunoblotting. Supernatants of the immunoprecipitation reactions were immunoblotted for β-actin to determine loading. (D) HeLa cells transfected with Bcr-abl as indicated were treated with JAK inhibitor 1 (0.5μM for 24 hours). Levels of IFNAR1 after treatment was determined by immunoprecipitation and immunoblotting. Loading of the immunoprecipitation mixture was determined by immunoblotting the supernatants for β-actin. (E) KT1 cells were treated with IM (0.5μM) or N-acetyl cysteine (NAC; 1 or 3 μg/mL). Levels of IFNAR1 after treatment was determined by immunoprecipitation and immunoblotting. Loading of the immunoprecipitation mixture was determined by immunoblotting the supernatants for β-actin. (F) KT1 cells were treated with CID755673 (20μM) for the indicated time points. IFNAR1 was immunoprecipitated, and phosphorylated Ser535 (pS535) and total IFNAR1 was assessed by Western blotting. (G) KT1 cells were treated with CID755673 (20μM) for 6 hours and then treated with IFNα (250 IU/mL for 30 minutes). Levels of p-STAT1 and total STAT1 in whole cell lysates (WCL) were determined by immunoblotting using the indicated antibodies.
Figure 5
Figure 5
Role of PKD2 in Bcr-abl–induced IFNAR1 down-regulation and inhibition of IFNα signaling. (A) HeLa cells stably transduced with control shRNA or shPKD2 were transfected with either Bcr-abl or empty vector with or without cotransfection of shRNA-insensitive GST-PKD2 or GST-PKD2Y438F. Endogenous IFNAR1 was purified by immunoprecipitation and analyzed by immunoblotting using the indicated antibodies. Whole cell lysates (WCL) from these cells also were analyzed by immunoblotting for levels of PKD2, Bcr-abl, and β-actin. (B) HeLa cells stably transduced with control shRNA or shPKD2 and transfected with Bcr-abl/empty vector with or without shRNA-insensitive GST-PKD2 or GST-PKD2Y438F (as described in panel A) were treated with IFNα (250 IU/mL for 30 minutes). Activation and levels of STAT1 as well the levels of Bcr-abl, PKD2, and β-actin were analyzed by immunoblotting. (C) KT1 cells were transfected with control shRNA (shCON) or shRNA against PKD2 (shPKD2) and cotransfected with plasmid encoding hygromycin resistance. After 48 hours of selection in hygromycin, interferon signaling was investigated by immunoblotting the WCL for p-STAT1 and STAT1 after treatment with IFNα (250 IU/mL for 30 minutes).
Figure 6
Figure 6
Role of IFNAR1 down-regulation in CML cell viability and clonogenicity. (A) KT1 cells were transfected with control shRNA or shPKD2 and cotransfected with plasmid encoding hygromycin resistance. The cells were kept under hygromycin selection for 48 hours, and viability in response to IFNα was assessed by trypan blue staining and depicted as relative values. (B) KT1 cells were transfected with empty vector, plasmid expressing wild-type IFNAR1, or IFNAR1S535A. The cells were cotransfected with plasmid encoding hygromycin resistance. The hygromycin-resistant cells were selected for 48 hours and analyzed for their viability after IFNα treatment as described in panel A. (C) Colony formation assays were carried out with CML samples from peripheral blood of patients in the chronic phase (773, 894, and 954) and blast crisis (623 and 967) who were positive for Bcr-abl expression. Cells were preincubated with either vehicle, IM (0.25μM), or IFNα (1000 IU/mL) for 6 hours followed by incubation with IFNα (1000 IU/mL) for 24 hours. Cells were then washed and plated in drug-free methylcellulose media, and the colonies were scored 2 weeks later and depicted as percentage relative to untreated controls. (D) Colony formation assays were carried out with CML samples from peripheral blood of patients in the chronic phase (62, 383, 586, 845, 852, 1000, 1067, 1276, 1953, and 2299) and blast crisis (834 and 1420) who were positive for Bcr-abl expression. Cells were preincubated with either vehicle, IM (0.15μM), or IFNα (150 IU/mL) for 6 hours followed by incubation in the methylcellulose media containing or not IFNα (150 IU/mL) for 3 weeks before the colonies were scored and depicted as percentage relative to untreated controls. Asterisks denote statistically significant (compared with other treatment groups) differences, *P < .05 and **P < .001.

Comment in

References

    1. Burke BA, Carroll M. BCR-ABL: a multi-faceted promoter of DNA mutation in chronic myelogenous leukemia. Leukemia. 2010;24(6):1105–1112. - PMC - PubMed
    1. Kharas MG, Fruman DA. ABL oncogenes and phosphoinositide 3-kinase: mechanism of activation and downstream effectors. Cancer Res. 2005;65(6):2047–2053. - PubMed
    1. Ren R. Mechanisms of BCR-ABL in the pathogenesis of chronic myelogenous leukaemia. Nat Rev Cancer. 2005;5(3):172–183. - PubMed
    1. Branford S, Rudzki Z, Harper A, et al. Imatinib produces significantly superior molecular responses compared to interferon alfa plus cytarabine in patients with newly diagnosed chronic myeloid leukemia in chronic phase. Leukemia. 2003;17(12):2401–2409. - PubMed
    1. O'Brien SG, Guilhot F, Larson RA, et al. Imatinib compared with interferon and low-dose cytarabine for newly diagnosed chronic-phase chronic myeloid leukemia. N Engl J Med. 2003;348(11):994–1004. - PubMed

Publication types

MeSH terms