

Lysophosphatidic acid receptor 1 modulates lipopolysaccharide-induced inflammation in alveolar epithelial cells and murine lungs
- PMID: 21821728
- PMCID: PMC3191756
- DOI: 10.1152/ajplung.00058.2011
Lysophosphatidic acid receptor 1 modulates lipopolysaccharide-induced inflammation in alveolar epithelial cells and murine lungs
Abstract
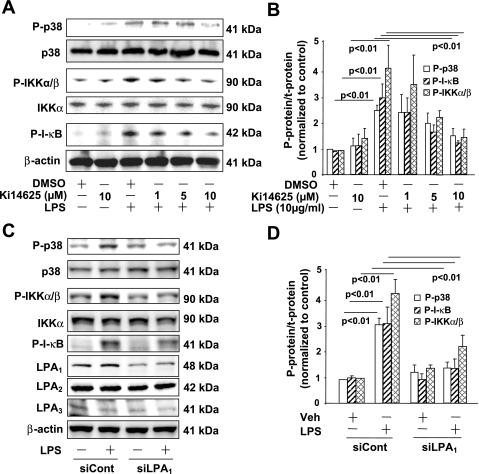
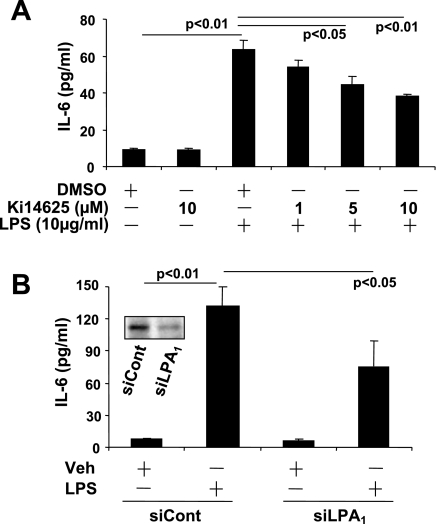
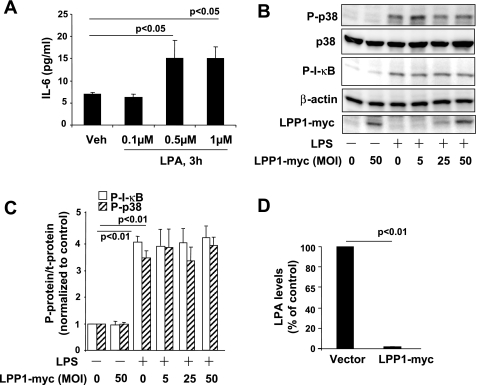
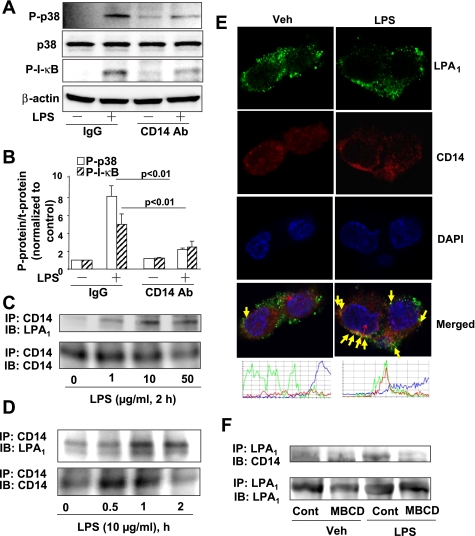
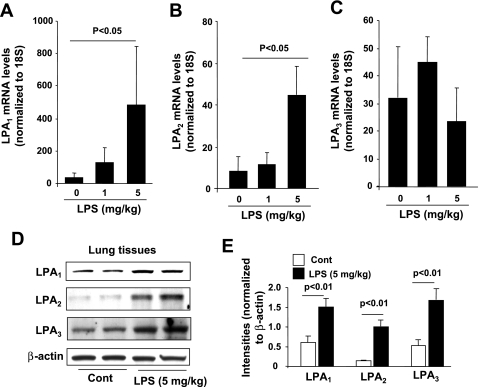
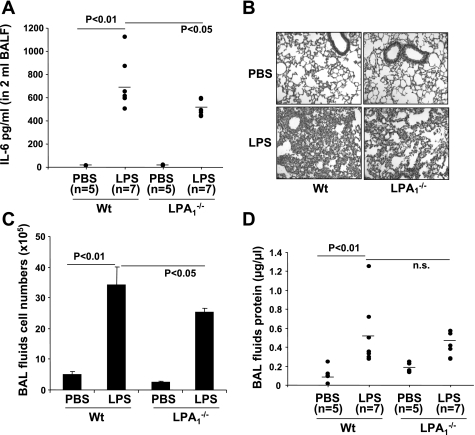
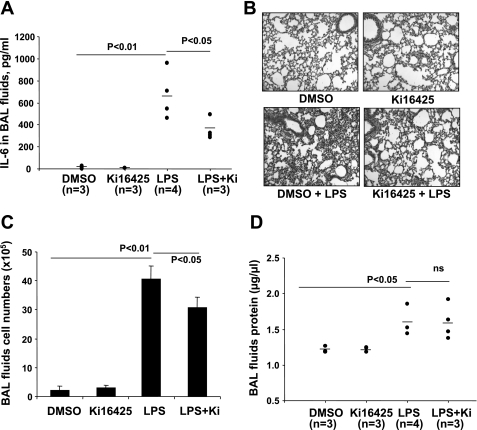
Lysophosphatidic acid (LPA), a bioactive phospholipid, plays an important role in lung inflammation by inducing the release of chemokines and lipid mediators. Our previous studies have shown that LPA induces the secretion of interleukin-8 and prostaglandin E(2) in lung epithelial cells. Here, we demonstrate that LPA receptors contribute to lipopolysaccharide (LPS)-induced inflammation. Pretreatment with LPA receptor antagonist Ki16425 or downregulation of LPA receptor 1 (LPA(1)) by small-interfering RNA (siRNA) attenuated LPS-induced phosphorylation of p38 MAPK, I-κB kinase, and I-κB in MLE12 epithelial cells. In addition, the blocking of LPA(1) also suppressed LPS-induced IL-6 production. Furthermore, LPS treatment promoted interaction between LPA(1) and CD14, a LPS coreceptor, in a time- and dose-dependent manner. Disruption of lipid rafts attenuated the interaction between LPA(1) and CD14. Mice challenged with LPS increased plasma LPA levels and enhanced expression of LPA receptors in lung tissues. To further investigate the role of LPA receptors in LPS-induced inflammation, wild-type, or LPA(1)-deficient mice, or wild-type mice pretreated with Ki16425 were intratracheally challenged with LPS for 24 h. Knock down or inhibition of LPA(1) decreased LPS-induced IL-6 release in bronchoalveolar lavage (BAL) fluids and infiltration of cells into alveolar space compared with wild-type mice. However, no significant differences in total protein concentration in BAL fluids were observed. These results showed that knock down or inhibition of LPA(1) offered significant protection against LPS-induced lung inflammation but not against pulmonary leak as observed in the murine model for lung injury.
Figures
Similar articles
-
Transcriptional regulation of lysophosphatidic acid-induced interleukin-8 expression and secretion by p38 MAPK and JNK in human bronchial epithelial cells.Biochem J. 2006 Feb 1;393(Pt 3):657-68. doi: 10.1042/BJ20050791. Biochem J. 2006. PMID: 16197369 Free PMC article.
-
Lysophosphatidic acid as a mediator for proinflammatory agonists in a human corneal epithelial cell line.Am J Physiol Cell Physiol. 2006 Nov;291(5):C1089-98. doi: 10.1152/ajpcell.00523.2005. Epub 2006 Jun 7. Am J Physiol Cell Physiol. 2006. PMID: 16760261
-
Lysophosphatidic acid receptor 1 antagonist ki16425 blunts abdominal and systemic inflammation in a mouse model of peritoneal sepsis.Transl Res. 2015 Jul;166(1):80-8. doi: 10.1016/j.trsl.2015.01.008. Epub 2015 Jan 31. Transl Res. 2015. PMID: 25701366 Free PMC article.
-
Lysophosphatidic acid signaling in airway epithelium: role in airway inflammation and remodeling.Cell Signal. 2009 Mar;21(3):367-77. doi: 10.1016/j.cellsig.2008.10.010. Epub 2008 Oct 26. Cell Signal. 2009. PMID: 18996473 Free PMC article. Review.
-
Lysophosphatidic acid (LPA) and its receptors: role in airway inflammation and remodeling.Biochim Biophys Acta. 2013 Jan;1831(1):86-92. doi: 10.1016/j.bbalip.2012.06.014. Epub 2012 Jul 15. Biochim Biophys Acta. 2013. PMID: 22809994 Free PMC article. Review.
Cited by
-
Sex-Biased Control of Inflammation and Metabolism by a Mitochondrial Nod-Like Receptor.Front Immunol. 2022 May 16;13:882867. doi: 10.3389/fimmu.2022.882867. eCollection 2022. Front Immunol. 2022. PMID: 35651602 Free PMC article.
-
Destabilization of Lysophosphatidic Acid Receptor 1 Reduces Cytokine Release and Protects Against Lung Injury.EBioMedicine. 2016 Aug;10:195-203. doi: 10.1016/j.ebiom.2016.07.020. Epub 2016 Jul 18. EBioMedicine. 2016. PMID: 27448760 Free PMC article.
-
Lysophosphatidic Acid Receptor 3 Suppress Neutrophil Extracellular Traps Production and Thrombosis During Sepsis.Front Immunol. 2022 Apr 7;13:844781. doi: 10.3389/fimmu.2022.844781. eCollection 2022. Front Immunol. 2022. PMID: 35464399 Free PMC article.
-
Autotaxin production of lysophosphatidic acid mediates allergic asthmatic inflammation.Am J Respir Crit Care Med. 2013 Oct 15;188(8):928-40. doi: 10.1164/rccm.201306-1014OC. Am J Respir Crit Care Med. 2013. PMID: 24050723 Free PMC article.
-
Deficiency or inhibition of lysophosphatidic acid receptor 1 protects against hyperoxia-induced lung injury in neonatal rats.Acta Physiol (Oxf). 2016 Mar;216(3):358-75. doi: 10.1111/apha.12622. Epub 2015 Nov 11. Acta Physiol (Oxf). 2016. PMID: 26495902 Free PMC article.
References
-
- Aoki J, Inoue A, Okudaira S. Two pathways for lysophosphatidic acid production. Biochim Biophys Acta 1781: 513–518, 2008 - PubMed
-
- Bosnar M, Bosnjak B, Cuzic S, Hrvacic B, Marjanovic N, Glojnaric I, Culic O, Parnham MJ, Erakovic Haber V. Azithromycin and clarithromycin inhibit lipopolysaccharide-induced murine pulmonary neutrophilia mainly through effects on macrophage-derived granulocyte-macrophage colony-stimulating factor and interleukin-1beta. J Pharmacol Exp Ther 331: 104–113, 2009 - PubMed
-
- Chaby R, Garcia-Verdugo I, Espinassous Q, Augusto LA. Interactions between LPS and lung surfactant proteins. J Endotox Res 11: 181–185, 2005 - PubMed
Publication types
MeSH terms
Substances
Grants and funding
LinkOut - more resources
Full Text Sources
Molecular Biology Databases
Research Materials
Miscellaneous