

Overcoming fluctuation and leakage problems in the quantification of intracellular 2-oxoglutarate levels in Escherichia coli
- PMID: 21821754
- PMCID: PMC3187092
- DOI: 10.1128/AEM.05257-11
Overcoming fluctuation and leakage problems in the quantification of intracellular 2-oxoglutarate levels in Escherichia coli
Abstract
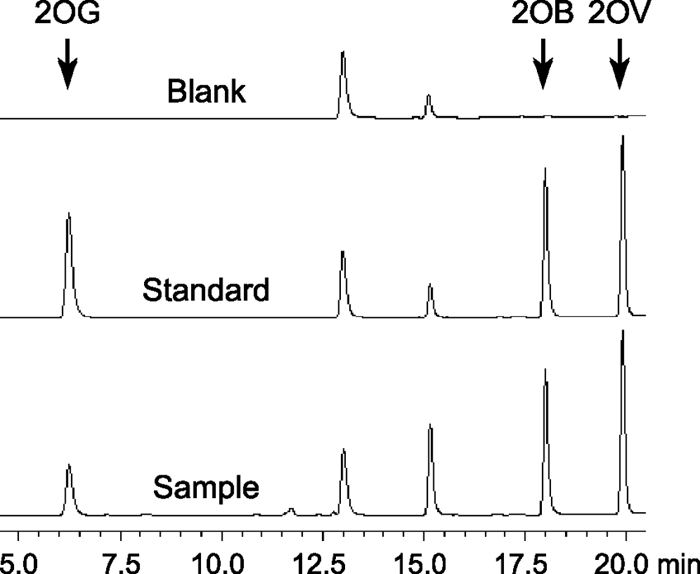
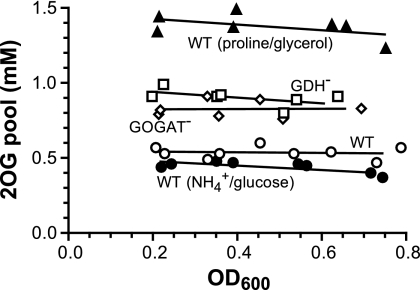
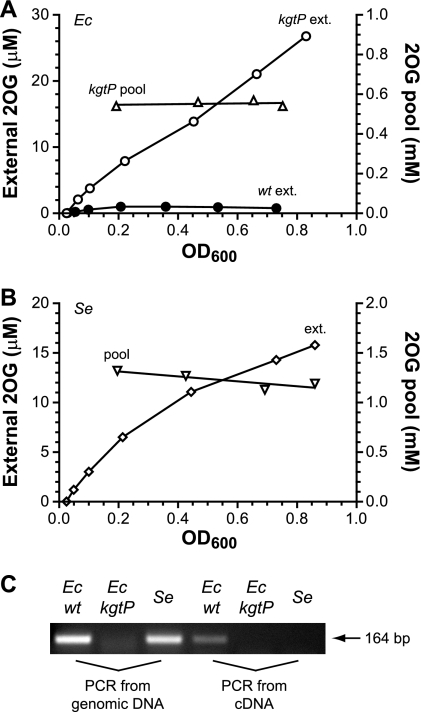
2-Oxoglutarate is located at the junction between central carbon and nitrogen metabolism, serving as an intermediate for both. In nitrogen metabolism, 2-oxoglutarate acts as both a carbon skeletal carrier and an effector molecule. There have been only sporadic reports of its internal concentrations. Here we describe a sensitive and accurate method for determination of the 2-oxoglutarate pool concentration in Escherichia coli. The detection was based on fluorescence derivatization followed by reversed-phase high-pressure liquid chromatography separation. Two alternative cell sampling strategies, both of which were based on a fast filtration protocol, were sequentially developed to overcome both its fast metabolism and contamination from 2-oxoglutarate that leaks into the medium. We observed rapid changes in the 2-oxoglutarate pool concentration upon sudden depletion of nutrients: decreasing upon carbon depletion and increasing upon nitrogen depletion. The latter was studied in mutants lacking either of the two enzymes using 2-oxoglutarate as the carbon substrate for glutamate biosynthesis. The results suggest that flux restriction on either reaction greatly influences the internal 2-oxoglutarate level. Additional study indicates that KgtP, a 2-oxoglutarate proton symporter, functions to recover the leakage loss of 2-oxoglutarate. This recovery mechanism benefits the measurement of cellular 2-oxoglutarate level in practice by limiting contamination from 2-oxoglutarate leakage.
Figures
Similar articles
-
The Emergence of 2-Oxoglutarate as a Master Regulator Metabolite.Microbiol Mol Biol Rev. 2015 Dec;79(4):419-35. doi: 10.1128/MMBR.00038-15. Microbiol Mol Biol Rev. 2015. PMID: 26424716 Free PMC article. Review.
-
Uptake of 2-oxoglutarate in Synechococcus strains transformed with the Escherichia coli kgtP gene.J Bacteriol. 2000 Jan;182(1):211-5. doi: 10.1128/JB.182.1.211-215.2000. J Bacteriol. 2000. PMID: 10613883 Free PMC article.
-
A single fluorescent protein-based sensor for in vivo 2-oxogluatarate detection in cell.Biosens Bioelectron. 2014 Apr 15;54:15-9. doi: 10.1016/j.bios.2013.10.038. Epub 2013 Oct 31. Biosens Bioelectron. 2014. PMID: 24240163
-
Determination of intracellular metabolites concentrations in Escherichia coli under nutrition stress using liquid chromatography-tandem mass spectrometry.Talanta. 2018 Nov 1;189:1-7. doi: 10.1016/j.talanta.2018.06.050. Epub 2018 Jun 18. Talanta. 2018. PMID: 30086891
-
Flux analysis and control of the central metabolic pathways in Escherichia coli.FEMS Microbiol Rev. 1996 Dec;19(2):85-116. doi: 10.1111/j.1574-6976.1996.tb00255.x. FEMS Microbiol Rev. 1996. PMID: 8988566 Review.
Cited by
-
Need-based activation of ammonium uptake in Escherichia coli.Mol Syst Biol. 2012;8:616. doi: 10.1038/msb.2012.46. Mol Syst Biol. 2012. PMID: 23010999 Free PMC article.
-
Classifying Interactions in a Synthetic Bacterial Community Is Hindered by Inhibitory Growth Medium.mSystems. 2022 Oct 26;7(5):e0023922. doi: 10.1128/msystems.00239-22. Epub 2022 Oct 5. mSystems. 2022. PMID: 36197097 Free PMC article.
-
Biosensors-Based In Vivo Quantification of 2-Oxoglutarate in Cyanobacteria and Proteobacteria.Life (Basel). 2018 Oct 27;8(4):51. doi: 10.3390/life8040051. Life (Basel). 2018. PMID: 30373229 Free PMC article.
-
Bifidobacterium infantis utilizes N-acetylglucosamine-containing human milk oligosaccharides as a nitrogen source.Gut Microbes. 2023 Dec;15(2):2244721. doi: 10.1080/19490976.2023.2244721. Gut Microbes. 2023. PMID: 37609905 Free PMC article.
-
Coordination of bacterial proteome with metabolism by cyclic AMP signalling.Nature. 2013 Aug 15;500(7462):301-6. doi: 10.1038/nature12446. Epub 2013 Aug 7. Nature. 2013. PMID: 23925119 Free PMC article.
References
-
- Alibhai M., Villafranca J. J. 1994. Kinetic and mutagenic studies of the role of the active site residues Asp-50 and Glu-327 of Escherichia coli glutamine synthetase. Biochemistry 33:682–686 - PubMed
-
- Bolten C. J., Kiefer P., Letisse F., Portais J. C., Wittmann C. 2007. Sampling for metabolome analysis of microorganisms. Anal. Chem. 79:3843–3849 - PubMed
Publication types
MeSH terms
Substances
LinkOut - more resources
Full Text Sources
Molecular Biology Databases
