. 2011 Sep 1;187(5):2405-17.
doi: 10.4049/jimmunol.1004175. Epub 2011 Aug 5.

Tolerance induced by apoptotic antigen-coupled leukocytes is induced by PD-L1+ and IL-10-producing splenic macrophages and maintained by T regulatory cells

Affiliations

Tolerance induced by apoptotic antigen-coupled leukocytes is induced by PD-L1+ and IL-10-producing splenic macrophages and maintained by T regulatory cells

Daniel R Getts et al. J Immunol. .

Abstract

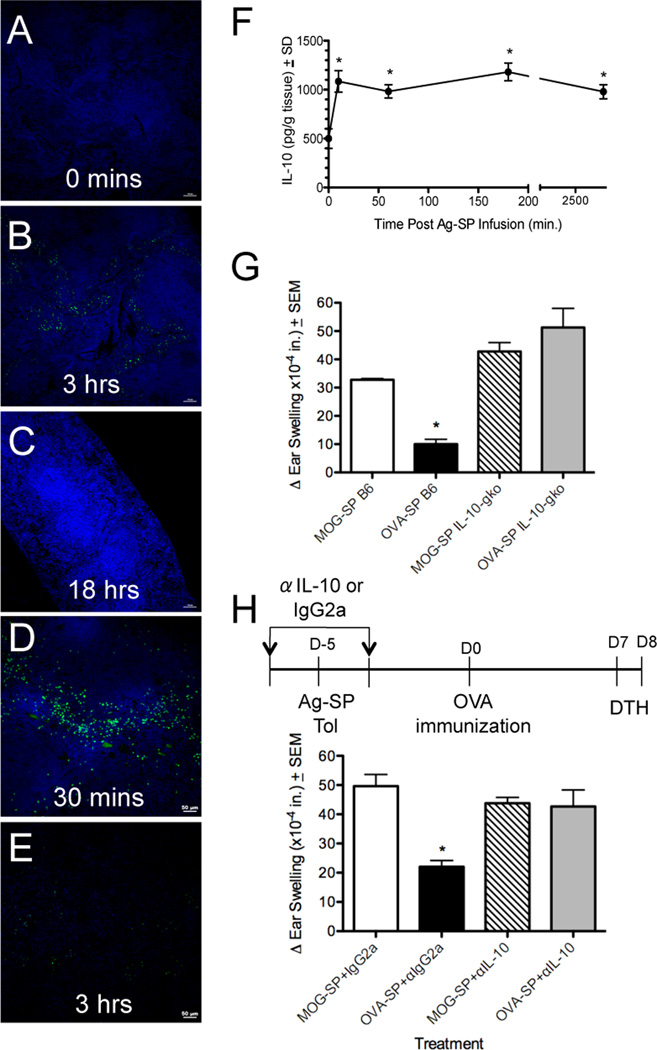
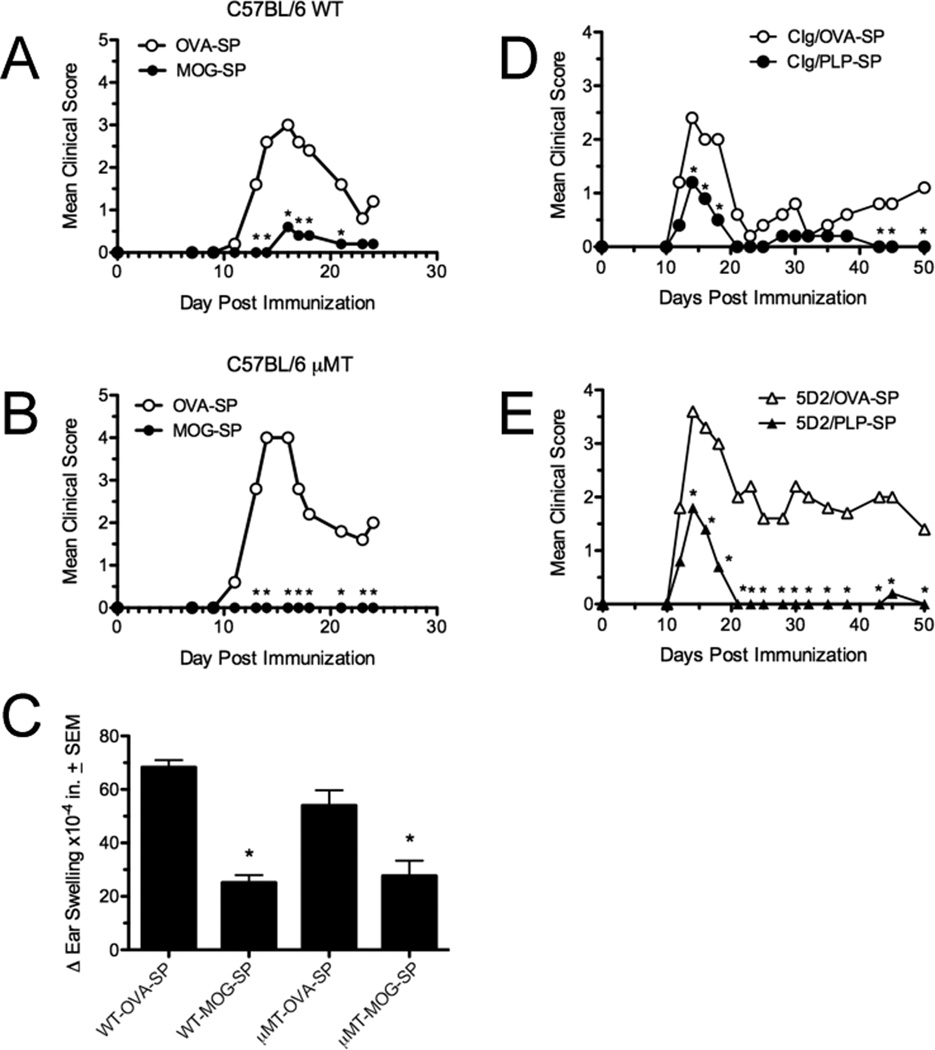
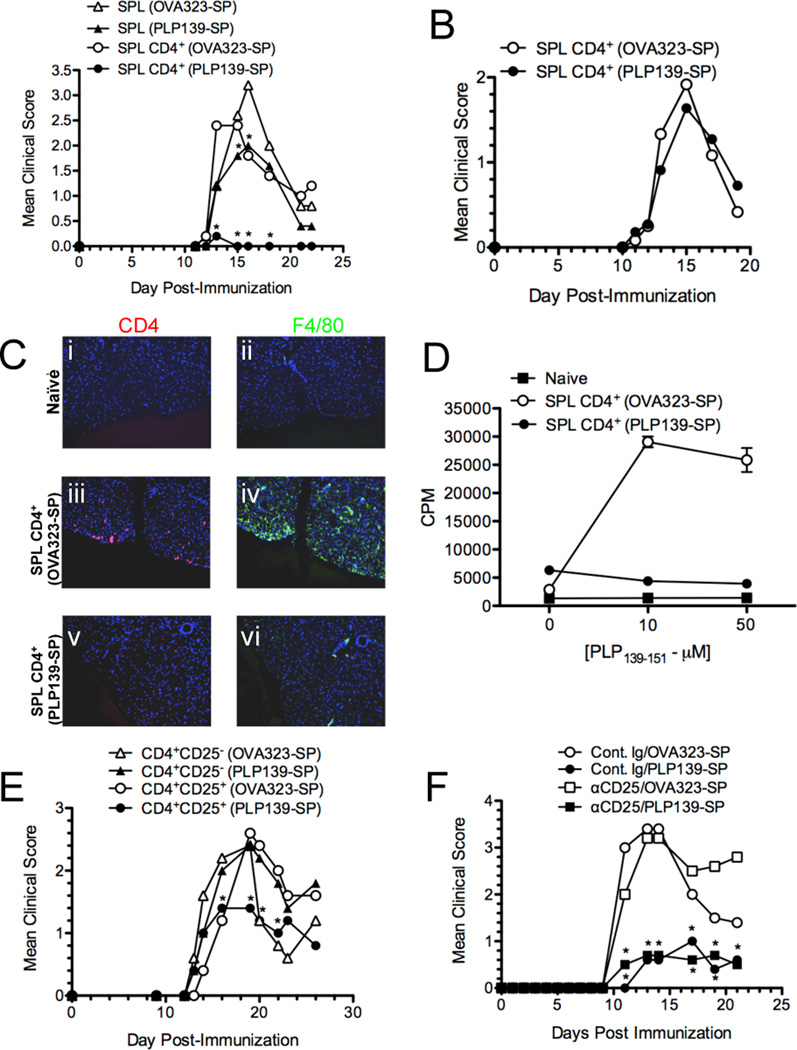
Ag-specific tolerance is a highly desired therapy for immune-mediated diseases. Intravenous infusion of protein/peptide Ags linked to syngeneic splenic leukocytes with ethylene carbodiimide (Ag-coupled splenocytes [Ag-SP]) has been demonstrated to be a highly efficient method for inducing peripheral, Ag-specific T cell tolerance for treatment of autoimmune disease. However, little is understood about the mechanisms underlying this therapy. In this study, we show that apoptotic Ag-SP accumulate in the splenic marginal zone, where their uptake by F4/80(+) macrophages induces production of IL-10, which upregulates the expression of the immunomodulatory costimulatory molecule PD-L1 that is essential for Ag-SP tolerance induction. Ag-SP infusion also induces T regulatory cells that are dispensable for tolerance induction but required for long-term tolerance maintenance. Collectively, these results indicate that Ag-SP tolerance recapitulates how tolerance is normally maintained in the hematopoietic compartment and highlight the interplay between the innate and adaptive immune systems in the induction of Ag-SP tolerance. To our knowledge, we show for the first time that tolerance results from the synergistic effects of two distinct mechanisms, PD-L1-dependent T cell-intrinsic unresponsiveness and the activation of T regulatory cells. These findings are particularly relevant as this tolerance protocol is currently being tested in a Phase I/IIa clinical trial in new-onset relapsing-remitting multiple sclerosis.


Figures

Figure 1
Figure 1. Role of the spleen and route of administration in Ag-SP tolerance induction
(A) SJL/J mice were tolerized with 5×10⁷ Sham OVA323–331-SP given i.v. (OVA323-SP i.v.) or with 5×10⁷ PLP139–151-SP given i.v. (PLP139-SP i.v.), s.c (PLP139-SP s.c.) or i.p. (PLP139-SP i.p.). 5d later, the mice were immunized with 50 µg PLP139–151/CFA and monitored for clinical EAE for 20 days post priming. (B–H) Scavenger receptor response to Ag-SP infusion. SJL/J mice were infused with 5×10⁷ PKH76-labeled PLP139-SP i.v. and spleens harvested for immunohistochemical staining 3 hours later. Expression of scavenger receptors LOX-1 (B), SR1B (C) and CD68 (D) were unaffected, but SRIIB was upregulated (F) compared to non-infused mice (E). Some co-localization of SRIIB and PKH76 was observed (white arrowhead in (H)) but not in isotype controls (G). (I & J) The spleen is required for Ag-SP tolerance. Sham splenectomized (Sham Splx) or splenectomized (Splx) SJL mice were tolerized with OVA323-SP or PLP139-SP on d-7, primed s.c. with 50 µg PLP139–151/CFA on d0 and DTH responses to PLP139–151 determined 8 d later (I). Asterisks denote a significant reduction in DTH responses (*p<0.0005). Data are representative of four experiments of five mice per group. (J) PLP139–151 specific proliferative responses from Sham Splx and Splx SJL mice were determined on d10. Asterisks denote a significant reduction in proliferative responses (*p<0.0001). Data examining the route of inoculation and splenectomized mice are representative of 2–3 experiments of five mice per group, with scavenger receptor examination determined from one experiment with 5 mice per group and at least 5 independent spleen sections examined.
Figure 2
Figure 2. Intravenously infused Ag-SP are rapidly removed from the spleen and trigger IL-10 production
(A–C) SJL/J mice were tolerized with 5×10⁷ PKH76-labeled OVA323-SP. Groups of 3–5 mice were sacrificed at 0, 3 and 18 h post-infusion. At least 20, 8µM sections were examined from each animal. PKH76-labeled sub-cellular debris present at 3 h (B) post-infusion was completely absent by 18 h (C). (D–E) A separate cohort of at least 4 animals was treated with 5×10⁷ CFSE-labeled OVA323-SP and mice were sacrificed 30 min and 3 h post-infusion. Numerous CFSE-labeled Ag-SP were observed at 30 min (D) but were completely absent by 3 h post infusion (E). IL-10 is secreted in response to Ag-SP infusion. Groups of at least 4 mice were infused with 5×10⁷ OVA323-SP, recipient spleens harvested at 0, 10, 60 and 180 min post-infusion and IL-10 levels in supernatants of individual homogenized spleens (run in triplicate) measured using ELISA. *IL-10 levels significantly higher than baseline (p<0.01). (F). IL-10-deficient mice can not be tolerized with OVA323–339 (G). Wild type (B6) and IL-10-deficient (IL-10gko) C57BL/6 mice were tolerized i.v. with 5×10⁷ syngeneic splenocytes from IL-10gko mice coupled with MOG35–55 (irrelevant peptide control) or OVA323–339 on day −5. On day 0, the mice were immunized with 200 µg OVA323–339/CFA and DTH responses to OVA323–331 ear challenge determined on day 7 (G). IL-10 neutralization prevents Ag-SP tolerance induction (H). Anti-IL-10 or control IgG2a antibody was given 30 min prior and 18 h after MOG35-SP or OVA323-SP infusion on day −5. Animals were immunized with OVA323–339/CFA on day 0, and DTH assessed on day 7. Asterisks denote a significant reduction in DTH responses (*p<0.0005) as compared to MOG35–55-SP controls. Data in all panels are representative of at least 3 experiments of at least 4 mice per group.
Figure 3
Figure 3. B cells are not required for induction of Ag-SP tolerance
Wildtype (A) and B cell-deficient (µMT) C57BL/6 mice (B) were tolerized i.v. with 5×10⁷ syngeneic MOG35-SP on day −7, primed with MOG35–551/CFA on day 0, and monitored for clinical EAE disease for 24 days post-priming. Data are representative of 2 experiments of 5 mice per group. On day +25 post-priming, MOG35–55-specific DTH responses were assessed (C). Wildtype SJL/J mice were treated with 250 µg of control Ig (D) or anti-mouse CD20 mAb (clone 5D2) (E) on day −12 followed by i.v. tolerization with 5×10⁷ PLP139-SP on day −7. Anti-CD20 treatment resulted in >95% reduction in B cells in the primary lymphoid organs, peritoneal cavity and the blood within 2 days of antibody injection. On day 0, the mice were primed with PLP139–151/CFA and monitored for disease incidence for 50 days post-priming. Data are representative of 2 experiments of 5 mice per group. Asterisks denote a significant reduction in mean clinical score or DTH responses (*p<0.01).
Figure 4
Figure 4. Tolerance is transferable with CD4+CD25+ T cells
SJL/J mice were tolerized on day −7 with 5×10⁷ OVA323-SP or PLP139-SP. On day 2, 5×10⁶ bulk splenocytes (SPL) or CD4+ splenocytes (SPL CD4+) from each treatment group were transferred i.v. to naïve recipients which were primed s.c. with 50 µg PLP139–151/CFA (A) or PLP178–191/CFA (B) on day 0 and monitored for clinical disease. Asterisks denote a significant reduction in clinical score in recipients of bulk or CD4+ splenocytes (*p<0.05). Data are representative of 2–3 experiments of 5–8 mice per group. (C) Two mice from the groups receiving splenic CD4+ T cells from OVA323-SP and PLP139-SP primed with PLP139–151/CFA were perfused on day +25. Spinal cords were stained with anti-CD4 (red) or anti-F4/80 (green) mAbs, and counterstained with DAPI (blue). Lumbar regions are shown at 200× magnification. (D) Spleens were harvested from 3 representative mice from each group on day +25 and proliferative responses determined. Data is representative of 2 experiments. (E) SJL/J mice were tolerized on d-7 with OVA323-SP or PLP139-SP as in Panel A. On day −2, 5×10⁶ CD4+CD25 or CD4+CD25+ splenocytes from the tolerized mice were transferred i.v. to naïve recipients which were primed s.c. with 50 µg PLP139–151/CFA and monitored for clinical disease. Asterisks denote a significant reduction in clinical score in recipients of CD4+CD25+ splenocytes (*p<0.05) from PLP139-SP tolerized mice. Data are representative of 2 experiments of 6–8 mice per group. (F) SJL/J mice (5–6 per group) were treated with 500 µg of Cont. Ig or anti-CD25 mAb (clone 7D4) on d-11 and d-9, tolerized with 5×10⁷ OVA323-SP or PLP139-SP on d-7, primed with PLP139–151/CFA on d0, and monitored for clinical signs of disease. Asterisks denote a significant reduction in clinical score of PLP139-SP treated mice (*p<0.01) in both control Ig and anti-CD25 treated mice. Data is representative of 3 separate experiments.
Figure 5
Figure 5. Tregs are dispensable for tolerance induction by Ag-SP, but required for long-term tolerance maintenance
(A) SJL/J mice were treated with 500 µg of Cont. Ig or anti-CD25 mAb (clone 7D4) on days −4 and −2. On day 0, the entire cohort of mice was tolerized with 5×10⁷ OVA323-SP or PLP139-SP. Separate groups of mice were primed with 50 µg PLP139–151/CFA on day +14 (B), day +35 (C), or day +63 (D) post-tolerization and followed for clinical signs of EAE. Data represent the clinical disease pattern of 5–6 mice per group and is representative of 2 separate experiments. (E and F) DTH responses of mice from panels C and D to challenge with PLP139–151 were determined following cessation of clinical disease assessment. Asterisks denote a significant reduction in clinical disease score (*p<0.01) and DTH responses (p<0.05).
Figure 6
Figure 6. Macrophage responses to Ag-SP in vivo and in vitro
In vivo response. Groups of at least 5 C57BL/6 mice were infused with nothing (No Ag-SP A, D & G), 5×10⁷ Non-ECDI fixed PKH26 (red)-labeled splenocytes (PKH-SP (No ECDI) B, E & H), or 5×10⁷ ECDI-fixed PKH26-labeled MOG35–55-SP (PKH-SP C, F & I). 8 hours later the spleens were harvested for immunohistochemistry. Spleen sections (8µM) were stained in green for CD11c (A–C), F4/80 (D–F) and IL-10 (G–I) and counterstained with DAPI (blue, Panels A–F). Similar to the non-fixed splenocyte control (B), little co-localization of Ag-SP with CD11c was observed (C). F4/80 commonly co-localized with PKH-26 in the Ag-SP treated animals (F). No IL-10 staining was observed in the untreated (G) or non-ECDI fixed splenocyte infused animals (H). Strong IL-10 production (indicated by the green stain) was commonly coincident with F4/80+ cells (indicated by the blue stain) (I). In vitro response. The macrophage cell line, J774 (K–M), thioglycollate-elicited (N–P) and non-elicited peritoneal macrophages (Q–S) were cultured on cover slips in 24 well plates and fed 106 OVA323–339-SP labeled with PKH26 (red) overnight. Supernatant was collected for IL-10 analysis and the remaining cover slips were fixed in PFA, counterstained with membrane dye PKH76 (green) and nuclei stained with DAPI (blue). Ag-SP remained PKH26+ after overnight incubation, the cells did not label with DAPI or PKH76 (J). J774 macrophages cultured alone (K) and demonstrating uptake of PKH26+ cell membranes (L), but failure to produce significant IL-10 (M). Thioglycollate-elicited peritoneal macrophages cultured alone (N) and demonstrating significant uptake of both fragments (white arrowhead) and cells (yellow arrowhead) (O), but failure to produce IL-10 (P). Resting peritoneal macrophages were cultured alone (Q) and demonstrating significant uptake of PKH26-labeled Ag-SP (R) and significant production of IL-10 (S). Data represents at least 6 independent wells, conducted in 2–3 separate experiments. Asterisk represents significant increase in the level of IL-10 (p<0.05).
Figure 7
Figure 7. Splenic macrophages uptake Ag-SP and express PD-L1 in an IL-10-dependent manner
Effect of Ag-SP infusion on splenic macrophage ratio. Five groups of SJL/J mice (4–5 mice per group) received IgG2a control antibody, anti-IL-10 alone, OVA323–339-SP + IgG2a antibody, OVA323–339-SP + anti-IL-10 antibody, or no treatment. All antibodies were given 30 min. prior to OVA323-SP infusion. 3h after infusion, animals were sacrificed and splenocytes stained with a cocktail of antibodies as described in the Materials and Methods. (A) Splenic APC populations were enumerated using the gating strategy shown; black population indicates the ungated isotype control for each dot plot. (B) Percentages of CD4+ DCs, CD8α+ DCs, and plasmacytoid DCs (pDC) did not change in any of the treatment groups, but percentages of macrophages increased in an IL-10-dependent fashion. F4/80+ splenic macrophages uptake Ag-SP and express PDL-1. Spleens from CD45.1+ C57BL/6 mice receiving either PBS (C) or 5×10⁷ CD45.2+ PKH-26-labeled, OVA323-SP (D) were harvested 2.5 hours after i.v. administration. Gate R1 represents recipient cells that have taken up donor Ag-SP, while Gate R2 represents intact Ag-Sp. Numbers adjacent to gate represent the percentage of cells within the gate (D). Relative CD45.2 expression on gates R1 (grey line) and R2 (black line) (E). Cells from gate R1 are 85% CD11b+ and 11.6% CD11chigh (F). Cells from gate R3 are 77.5% F4/80int and 11.3% F4/80high. The majority of the cells in gate R3 were CD11cint which is consistent with the phenotype of splenic MZ macrophages (G). >73% of cells from R3 (i.e. those that are of recipient origin, the majority being F4/80+ macrophages) that have engulfed Ag-SP express PD-L1 (H). PD-L1 expression increases in the CD8α+ DC and F4/80+ macrophage populations and expression is reversed by anti-IL-10 in macrophages (I). Data is representative of 2 separate experiments. Asterisks denotes a significant change in APC subset ratio/expression compared to animals treated with IgG2a control antibody (*p<0.05). PD-L1 Expression is Required for Ag-SP Tolerance. PD-L1 blockade prevents Ag-SP tolerance induction. SJL/J mice were treated with anti-PD-L1 or control IgG2a antibody as detailed in the Materials and Methods. Mice were tolerized with OVA323-SP or PLP139-SP on day −7. Animals were immunized with PLP139–151/CFA on day 0, and DTH assessed on day 7. Asterisks denote a significant reduction in DTH responses (*p<0.01) as compared to MOG35–55-SP controls. Results are representative of two separate experiments of at least five mice per group.

References

    1. Chatenoud L, Bluestone JA. CD3-specific antibodies: a portal to the treatment of autoimmunity. Nat. Rev. Immunol. 2007;7:622–632. - PubMed
    1. Kohm AP, Turley DM, Miller SD. Targeting the TCR: T-cell receptor and peptide-specific tolerance-based strategies for restoring self-tolerance in CNS autoimmune disease. Int. Rev. Immunol. 2005;24:361–392. - PubMed
    1. Miller SD, Turley DM, Podojil JR. Antigen-specific tolerance strategies for the prevention and treatment of autoimmune disease. Nat. Rev. Immunol. 2007;7:665–677. - PubMed
    1. Jenkins MK, Schwartz RH. Antigen presentation by chemically modified splenocytes induces antigen-specific T cell unresponsiveness in vitro and in vivo. J. Exp. Med. 1987;165:302–319. - PMC - PubMed
    1. Luo X, Pothoven KL, McCarthy D, DeGutes M, Martin A, Getts DR, Xia G, He J, Zhang X, Kaufman DB, Miller SD. ECDI-fixed allogeneic splenocytes induce donor-specific tolerance for long-term survival of islet transplants via two distinct mechanisms. Proc. Natl. Acad. Sci. USA. 2008;105:14527–14532. - PMC - PubMed

Publication types

MeSH terms