. 2011 Sep;121(9):3645-56.
doi: 10.1172/JCI46274. Epub 2011 Aug 8.

Regulatory B cells are identified by expression of TIM-1 and can be induced through TIM-1 ligation to promote tolerance in mice

Affiliations

Regulatory B cells are identified by expression of TIM-1 and can be induced through TIM-1 ligation to promote tolerance in mice

Qing Ding et al. J Clin Invest. 2011 Sep.

Abstract

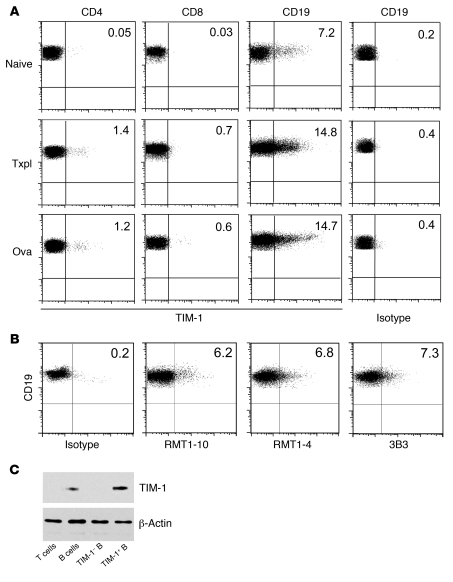
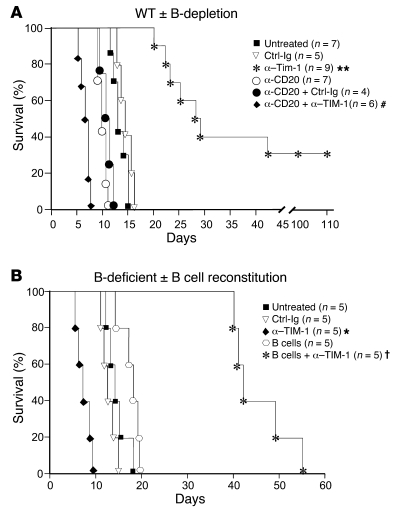
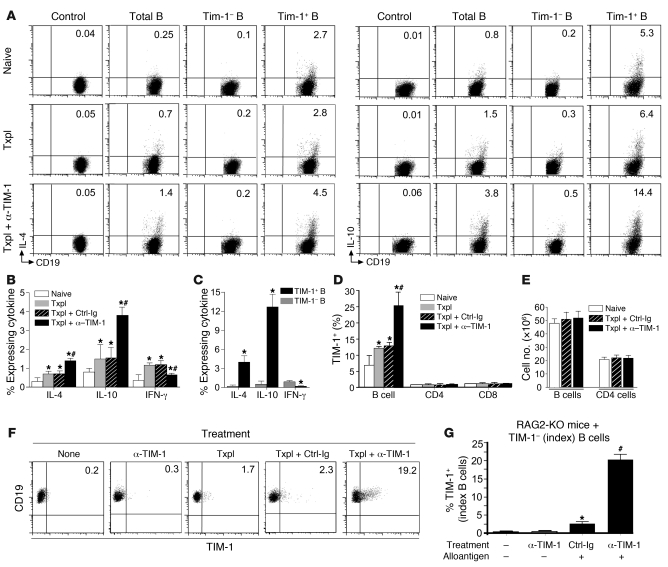
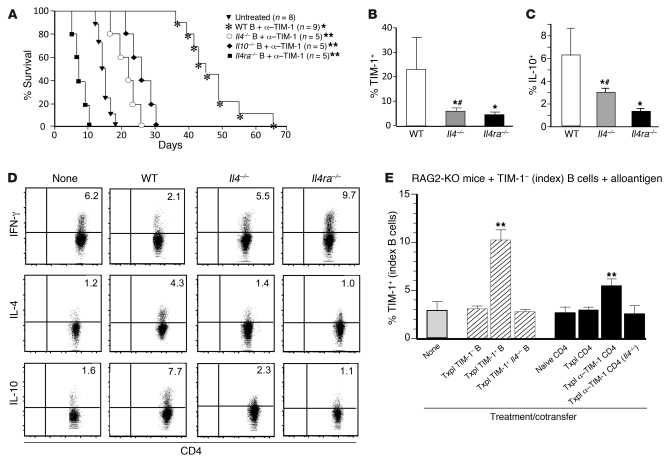
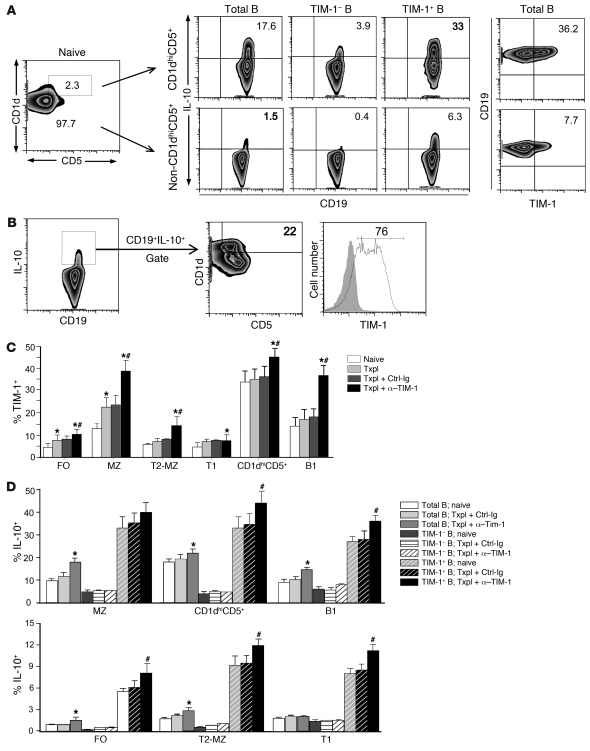
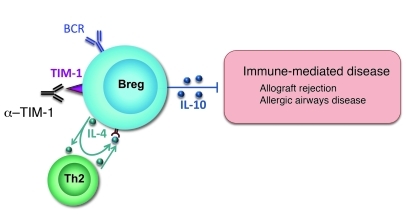
T cell Ig domain and mucin domain protein 1 (TIM-1) is a costimulatory molecule that regulates immune responses by modulating CD4+ T cell effector differentiation. However, the function of TIM-1 on other immune cell populations is unknown. Here, we show that in vivo in mice, TIM-1 is predominantly expressed on B rather than T cells. Importantly, TIM-1 was expressed by a large majority of IL-10-expressing regulatory B cells in all major B cell subpopulations, including transitional, marginal zone, and follicular B cells, as well as the B cell population characterized as CD1d(hi)CD5+. A low-affinity TIM-1-specific antibody that normally promotes tolerance in mice, actually accelerated (T cell-mediated) immune responsiveness in the absence of B cells. TIM-1+ B cells were highly enriched for IL-4 and IL-10 expression, promoted Th2 responses, and could directly transfer allograft tolerance. Both cytokine expression and number of TIM-1+ regulatory B cells (Bregs) were induced by TIM-1-specific antibody, and this was dependent on IL-4 signaling. Thus, TIM-1 is an inclusive marker for IL-10+ Bregs that can be induced by TIM-1 ligation. These findings suggest that TIM-1 may be a novel therapeutic target for modulating the immune response and provide insight into the signals involved in the generation and induction of Bregs.


Figures

Figure 1
Figure 1. B lymphocytes express relatively high levels of TIM-1.
(A) Representative flow cytometry plots showing TIM-1 expression on splenic CD4+ and CD8+ T cells and CD19+ B cells in naive BALB/c mice or at 14 days after immunization with either allogeneic (B6) islet transplantation (Txpl) or OVA (20 μg with 4 mg alum i.p. on days 0 and 7). Cell staining was performed in the presence of anti-CD16/CD32 to block FcR binding, and isotype- and fluorochrome-matched negative controls were used to set the cursors. Isotype control staining for CD19+ cells is shown at right. n ≥ 3 per group. (B) Representative flow cytometry plots showing TIM-1 expression on CD19+ B cells from naive mice assessed by indirect staining with anti–TIM-1 mAbs RMT1-10, RMT1-4, and 3B3 followed by PE-conjugated anti-rat Ig secondary mAb. n = 3 per group. (C) Anti–TIM-1 immunoblot of cell lysates from sort-purified T cells, B cells, TIM-1+ B cells, and TIM-1 B cells. Representative of 2 independent experiments. Numbers denote percent TIM-1+ cells within each population.
Figure 2
Figure 2. B lymphocytes are required for anti–TIM-1–mediated prolongation of allograft survival.
(A) Chemically diabetic BALB/c mice were untreated or subjected to B cell depletion with anti-CD20 (250 μg i.v. on days –14 and –1) followed by transplantation with B6 islets. Allograft recipients were either untreated or treated with RMT1-10 or control Ig at 0.5 mg (day –1) and 0.3 mg (days 0 and 5). (B) JHD mice were unmanipulated or received 107 WT syngeneic B cells followed by transplantation with B6 islets (day 0). Allograft recipients were treated as in A. Shown are Kaplan-Meir plots of graft survival. *P < 0.05, **P < 0.01 vs. untreated or control Ig; #P < 0.05 vs. other anti-CD20 groups; P < 0.01 vs. B cells.
Figure 3
Figure 3. B lymphocytes are required for Th2-deviation induced by anti–TIM-1.
IL-4 EGFP reporter mice (BALB/c) were untreated or subjected to B cell depletion with anti-CD20 followed by transplantation with B6 islets. Allograft recipients were either untreated or treated with anti–TIM-1 or control Ig as in Figure 2. On day 14 after transplantation, cytokine expression on splenic CD4+ T cells was examined by flow cytometry after in vitro stimulation (see Methods). IL-4 was detected by EGFP expression, and IFN-γ, IL-10, and Foxp3 were detected by intracellular staining. (A) Representative IL-4, IFN-γ, and IL-10 expression on CD4+ T cells, determined by flow cytometry. n ≥ 5 mice/group. (B) Representative Foxp3 and IL-10 expression by CD4+ T cells, determined by flow cytometry. n = 3 mice/group. (C) Frequency (mean + SD) gated on CD4+ T cells expressing IFN-γ, IL-4, or IL-10 in naive mice or allograft recipients treated as indicated. n ≥ 5 mice/group. *P < 0.05 vs. untreated or control Ig–treated allograft recipients; P < 0.05 vs. other anti-CD20–treated allograft recipients; #P < 0.05 vs. anti–TIM-1–treated allograft recipients. Numbers denote percent of gated cells within the respective quadrants.
Figure 4
Figure 4. IL-4 and IL-10 are expressed by TIM-1+ B cells and induced by TIM-1 ligation.
Splenic CD19+ B cells from BALB/c mice were naive, transplanted with B6 islets, or transplanted and treated with anti–TIM-1 or control Ig on day 14. (A) IL-4 and IL-10 expression, gated on CD19+ B cells (control and total B cells) or on TIM-1 and TIM-1+ B cells. IL-4 (EGFP) versus control (WT littermates); IL-10 (intracellular staining) versus control (isotype). (B) Frequency (mean + SD) of B cells expressing cytokines from mice in A. *P < 0.05 vs. naive; #P < 0.05 vs. all other groups. (C) Frequency (mean + SD) of cytokine expression on TIM-1 versus TIM-1+ B cells from anti–TIM-1–treated allograft recipients. *P < 0.01 vs. TIM-1. (D) TIM-1 expression (mean + SD) on B, CD4+ T, and CD8+ T cells. *P < 0.05 vs. naive; #P < 0.05 vs. all other groups. (E) Total number (mean + SD) of splenic B and CD4+ T cells. (AE) n ≥ 5 mice/group in at least 3 experiments. (F and G) Sorted TIM-1 “index” B cells (see Methods) from naive BALB/c mice were transferred into syngeneic JHD (F) or RAG2-KO (G) mice. Recipients were naive or were exposed to alloantigen (allograft or allogeneic splenocytes) with or without anti–TIM-1 or control Ig. TIM-1 expression on index B cells recovered from spleen (day 14) is shown in representative dot plots (F), or as frequency (G; mean + SD). n = 3 mice/group. *P < 0.05 vs. no allograft; #P < 0.01 vs. all other groups. Numbers denote percent cells in the respective quadrants.
Figure 5
Figure 5. B cell–mediated prolongation of allograft survival requires IL-4–dependent TIM-1 and IL-10 expression.
Diabetic JHD recipients of C57B/6 allografts were reconstituted with 107 naive B cells from WT, Il4–/–, Il4ra–/–, or Il10–/– mice and treated with anti–TIM-1. (A) Kaplan-Meir plots of graft survival. *P < 0.01, **P < 0.05 vs. untreated. TIM-1 (B) and IL-10 (C) expression (mean + SD) on transferred B cells (day 14), detected by flow cytometry. *P < 0.01 vs. WT; #P < 0.05 vs. Il4ra–/–. (D) Representative IL-4, IFN-γ, and IL-10 expression, assessed by flow cytometry, on endogenous CD4+ T cells 14 days after B cell transfer in the JHD recipients. Numbers denote percent CD4+ T cells expressing IL-4, IFN-γ, and IL-10. (E) Sorted index B cells from naive BALB/c mice were adoptively transferred into syngeneic RAG2-KO recipients of B6 islets. Mice received 107 sort-purified congenic TIM-1, TIM-1+, or Il4–/– TIM-1+ B cells from allostimulated BALB/c mice. Alternatively, mice received 107 sort-purified CD4+ T cells from WT or Il4–/– BALB/c mice (naive, allostimulated, or allostimulated and treated with anti–TIM-1). Shown is frequency (mean + SD) of TIM-1 expression on index B cells in spleen 14 days after transfer. **P < 0.05 vs. other groups. (BE) n = 3 mice/group.
Figure 6
Figure 6. TIM-1+ B cells prolong allograft survival in a donor-specific and IL-10–dependent manner.
(A) WT, Il4ra–/–, or Il10–/– BALB/c recipients of B6 islets were treated with anti–TIM-1. On day 14, splenic TIM-1+ and TIM-1 B cells were sort-purified and transferred (107) into otherwise-untreated JHD recipients of islet allografts from the same (B6) strain. Shown are Kaplan-Meir plots of graft survival. #P < 0.01 vs. all other groups; *P < 0.05 vs. untreated. (B) TIM-1+ B cells from spleen of naive BALB/c mice or from untreated BALB/c recipients of B6 or C3H islet allografts (day 14) were sort-purified and transferred (107) into JHD recipients of B6 islets without further treatment. Shown are Kaplan-Meir plots of graft survival. #P < 0.01 vs. other groups. (C) JHD IL-4 EGFP (JHD×4get) recipients of B6 islets were untreated or received 107 TIM-1+ or TIM-1 B cells from anti–TIM-1–treated BALB/c allograft recipients as in A. Shown is representative IL-4 (EGFP) or IFN-γ, IL-10, and Foxp3 (intracellular staining) expression by flow cytometry on splenic CD4+ T cells from recipients 14 days after receiving TIM-1+, TIM-1, or no B cells. Numbers denote percent CD4+ T cells expressing IL-4, IFN-γ, IL-10, or Foxp3. n = 3 mice/group.
Figure 7
Figure 7. TIM-1+ B cells are highly enriched for IL-10 expression across a wide spectrum of phenotypes.
BALB/c splenocytes were assessed for expression of various cell surface markers and IL-10 by multicolor flow cytometry. n = 3–6 mice/group in at least 3 independent experiments. (A) Left: Representative expression of CD5 versus CD1d on CD19+ B cells in naive mice with the CD1dhiCD5+ population (2.3% of total B cells; rectangular gate). Right: IL-10 and TIM-1 expression on CD19+ (total B) and on TIM-1+ and TIM-1 B cells within the CD1dhiCD5+ and non-CD1dhiCD5+ B cell populations. (B) Representative expression of markers on CD19+IL-10+ B cells. Cells within the IL-10+ B cell gate were assessed for CD1d and CD5 or TIM-1 expression. (C) Percent (mean + SD) B cells expressing TIM-1 within FO, MZ, T2-MZ, T1, CD1dhiCD5+, and B1 B cells from naive and transplanted mice with or without anti–TIM-1 or control Ig treatment. *P < 0.05 vs. naive; #P < 0.05 vs. other allograft recipients. (D) IL-10 expression (mean + SD) on B cell subpopulations and mice as in C. *P < 0.05 vs. other total B cell groups; #P < 0.05 vs. other TIM-1+ B cell groups. P < 0.05, TIM-1+ vs. TIM-1 (all groups). Numbers denote percent cells within the designated areas.
Figure 8
Figure 8. Model of TIM-1+IL-10+ Breg induction.
TIM-1+ B cells account for most IL-4+ and IL-10+ B cells, and both cytokines and TIM-1 itself can be induced by anti–TIM-1 in the face of BCR ligation. B cell IL-4 is required to promote IL-4 expression by Th2 cells in the allograft setting. IL-4 receptor signaling in B cells is essential both for TIM-1 expression and for IL-10 production by B cells. IL-4 can be derived from either B cells themselves or from Th2 cells. IL-10 expression is required for Breg activity, but not for TIM-1 expression.

References

    1. Kuchroo VK, Dardalhon V, Xiao S, Anderson AC. New roles for TIM family members in immune regulation. Nat Rev Immunol. 2008;8(8):577–580. doi: 10.1038/nri2366. - DOI - PubMed
    1. McIntire JJ, et al. Identification of Tapr (an airway hyperreactivity regulatory locus) and the linked Tim gene family. Nat Immunol. 2001;2(12):1109–1116. doi: 10.1038/ni739. - DOI - PubMed
    1. Chae SC, Park YR, Song JH, Shim SC, Yoon KS, Chung HT. The polymorphisms of Tim-1 promoter region are associated with rheumatoid arthritis in a Korean population. Immunogenetics. 2005;56(10):696–701. doi: 10.1007/s00251-004-0743-5. - DOI - PubMed
    1. Umetsu SE, et al. TIM-1 induces T cell activation and inhibits the development of peripheral tolerance. Nat Immunol. 2005;6(5):447–454. doi: 10.1038/ni1186. - DOI - PubMed
    1. Meyers JH, et al. TIM-4 is the ligand for TIM-1, and the TIM-1-TIM-4 interaction regulates T cell proliferation. Nat Immunol. 2005;6(5):455–464. doi: 10.1038/ni1185. - DOI - PubMed

Publication types

MeSH terms