. 2011 Sep;121(9):3528-41.
doi: 10.1172/JCI45557. Epub 2011 Aug 8.

Preclinical assessment of CNS drug action using eye movements in mice

Affiliations

Preclinical assessment of CNS drug action using eye movements in mice

Hugh Cahill et al. J Clin Invest. 2011 Sep.

Abstract

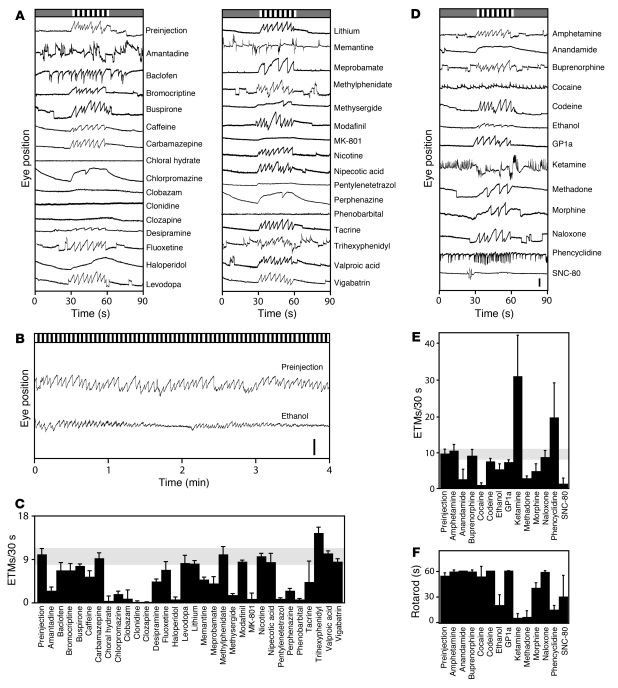
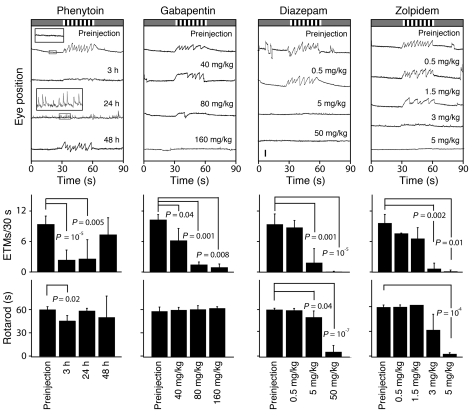
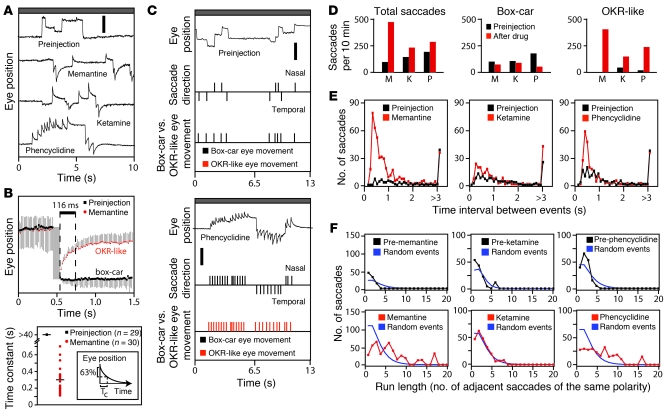
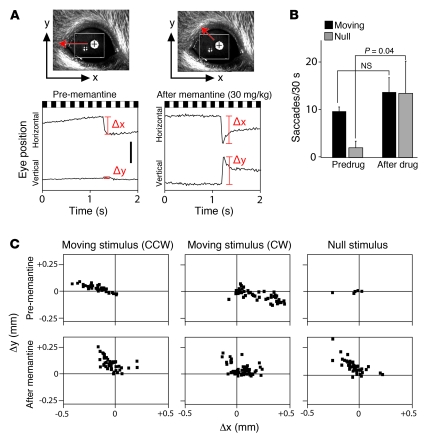
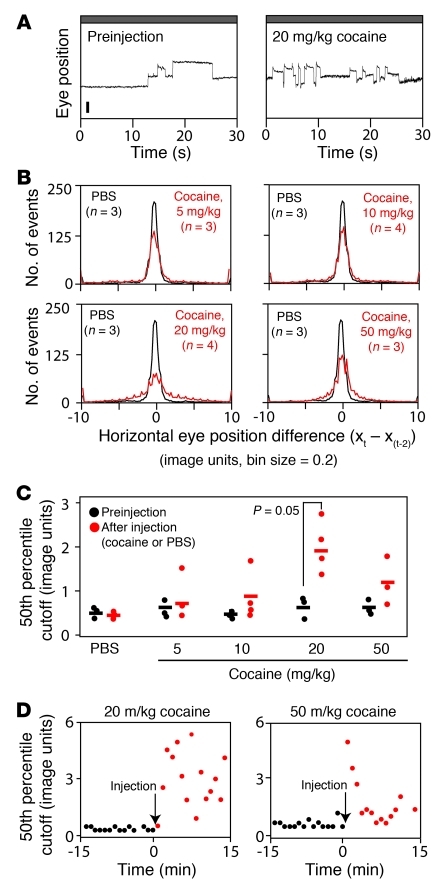
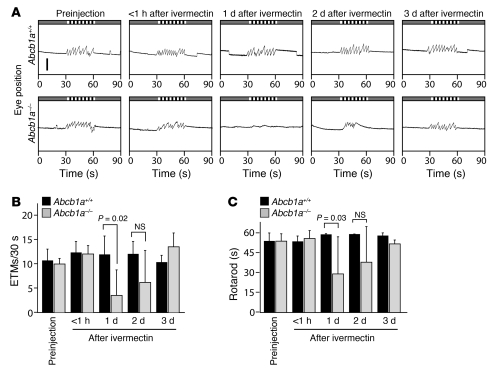
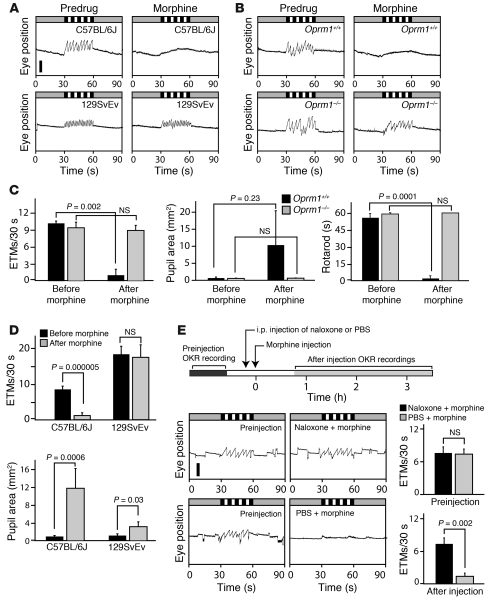
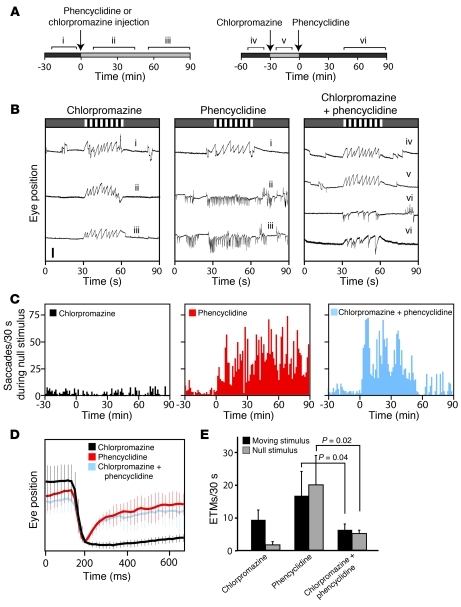
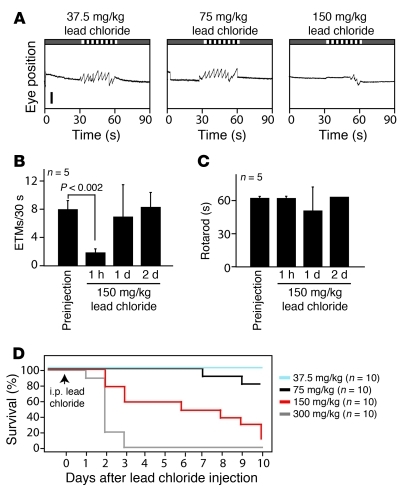
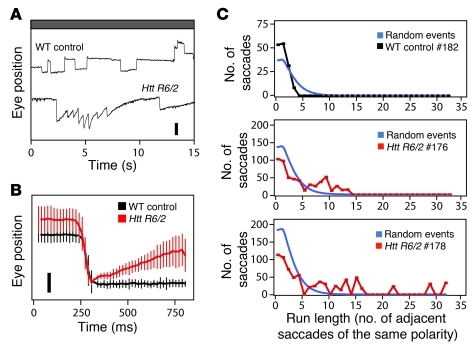
The drug development process for CNS indications is hampered by a paucity of preclinical tests that accurately predict drug efficacy in humans. Here, we show that a wide variety of CNS-active drugs induce characteristic alterations in visual stimulus-induced and/or spontaneous eye movements in mice. Active compounds included sedatives and antipsychotic, antidepressant, and antiseizure drugs as well as drugs of abuse, such as cocaine, morphine, and phencyclidine. The use of quantitative eye-movement analysis was demonstrated by comparing it with the commonly used rotarod test of motor coordination and by using eye movements to monitor pharmacokinetics, blood-brain barrier penetration, drug-receptor interactions, heavy metal toxicity, pharmacologic treatment in a model of schizophrenia, and degenerative CNS disease. We conclude that eye-movement analysis could complement existing animal tests to improve preclinical drug development.


Figures

Figure 1
Figure 1. Survey of drug effects on the OKR.
Drugs were delivered by i.p. injection at the doses listed in Supplemental Tables 1 and 2. (AC) Medicinal and miscellaneous psychoactive compounds. (A) Representative 90-second OKR responses to 30 seconds of rotating black and white stripes, preceded and followed by 30 seconds of a uniform gray. Visual stimuli are represented schematically at the top of each panel. Scale bar: 0.5 mm. (B) Four-minute OKR record with continuously rotating black and white stripes after i.p. injection of 2 g/kg ethanol as a 25% ethanol solution in PBS, i.e., equivalent to a blood alcohol level of approximately 0.2%. Scale bar: 1 mm. (C) Quantification of ETM30 during the moving stimulus interval. (DF) Drugs of abuse and related compounds. (D and E) Representative 90-second OKR records and their quantification, as described for A and C. Scale bar: 0.5 mm. (F) Rotarod performance. For this and all other rotarod experiments, mice were given the same drug doses as shown for the OKR. In most cases, mice were tested immediately after OKR testing. Rotarod performance is quantified as the time to fall off a cylinder rotating at 7 revolutions per minute. Trials were terminated at 60 seconds. Between 2 and 7 mice were tested per drug. Data are presented as the mean ± standard deviation.
Figure 2
Figure 2. Quantifying the dose response and time course of drug action.
OKR and rotarod performance at the indicated times after a single i.p. injection of 85 mg/kg phenytoin or approximately 30–60 minutes after the indicated doses of gabapentin, diazepam, or zolpidem. Top panels show representative 90-second OKR records; center panels quantify the ETM30 during the rotating visual stimulus interval; and bottom panels quantify rotarod performance, as described in Figure 1. For phenytoin, boxed regions from the preinjection and 24-hour postinjection OKR records are enlarged 4 fold and shown as insets. The number of mice tested per time point or drug concentration is as follows: phenytoin, 3–6 mice; gabapentin, 3 mice; diazepam, 3–5 mice; and zolpidem, 3 mice. In the histograms, each ETM30 and rotarod data point was compared by t test to the preinjection control; only those comparisons with P < 0.05 are shown. P values of less than 10–4 are rounded to the nearest factor of 10. Scale bar: 0.5 mm. Data are presented as the mean ± standard deviation.
Figure 3
Figure 3. Drug-induced OKR-like responses in the absence of a moving visual stimulus.
(A) Eye movements in the absence of a moving visual stimulus before and after an i.p. injection of ketamine (8 mg/kg), memantine (23 mg/kg), or phencyclidine (4 mg/kg). Scale bar: 0.5 mm. (B) Spontaneous eye movements before (n = 29) and after (n = 30) i.p. memantine, with saccade amplitudes normalized and traces temporally aligned by the saccade, and the time constant (TC) of the best-fitting exponential for each recording of eye position versus time for the 116 milliseconds immediately after the saccade. The inset shows a graphical definition of TC as the time corresponding to a 63% change in eye position, following exponential kinetics. Horizontal bars represent the mean. (C) Automated identification of box-car (black) versus OKR-like (red) spontaneous eye movements in 2 thirteen-second recordings, with or without i.p. phencyclidine. For each recording, the timing and polarity of the fast components were scored (central quantized trace), and then each saccade was categorized as box-car or OKR-like (bottom quantized trace). Scale bar: 1 mm. (D) Total (left), box-car–shaped (center), and OKR-like (right) saccades during a 10-minute recording obtained before (black) or after (red) the indicated drug. M, memantine; K, ketamine; P, phencyclidine. (E) Distribution of time intervals between adjacent fast components before versus after drug administration. (F) Clustering of saccade polarity: the number of adjacent saccades of the same polarity within a 10-minute interval before versus after drug administration. Blue lines show the calculated distribution of adjacent saccades of the same polarity for a matched number of saccades divided equally into positive and negative polarities and randomly ordered in time. For each drug, the data shown are from a single representative mouse. Data in B are presented as the mean ± standard deviation.
Figure 4
Figure 4. Memantine induces saccades with a large vertical component.
(A) Representative eye movements in response to rotating black and white stripes before or after 30 mg/kg i.p. memantine. Predrug saccades are confined largely to the horizontal (x) axis, whereas postmemantine saccades also have a large vertical (y) component. Scale bar: 0.5 mm. (B) The number of saccades during alternating 30-second moving visual stimulus and rest (null stimulus) periods, as defined in Figure 1. Memantine induces spontaneous saccades during the rest periods but has little effect on saccade frequency in response to a visual stimulus. (C) Saccade amplitudes and 2-dimensional trajectories (as defined in A) before and after memantine in response to clockwise (CW) or counterclockwise (CCW) rotating visual stimuli or in the absence of a moving stimulus (null). After memantine injection, large vertical components are common in response to CCW motion and among spontaneous eye movements. Data in B are averages from 3 mice; data in C are from a single representative mouse.
Figure 5
Figure 5. Quantifying the increase in spontaneous eye movements induced by cocaine.
(A) Representative 30-second records of spontaneous eye movements (i.e., with no moving visual stimulus) recorded prior to and after an i.p. injection of 20 mg/kg cocaine. The box-car shape of the eye movements is retained, but the frequency of movements increases after cocaine administration. (B) Histograms for individual mice showing horizontal eye position differences between time points separated by 2 seconds (XtXt–2) and sampled at 16.7-millisecond intervals. Data are the XtXt–2 averages for the 15 minutes immediately after i.p. injection of PBS (black) or cocaine (red) at the indicated doses. n indicates the number of mice averaged per condition. Horizontal eye position (x) is plotted in “image units,” a distances measure in the video image. (C) 50th percentile cutoff value for the XtXt–2 distributions for each mouse. Horizontal bars represent the mean. Individual symbols represent individual mice. (D) Time course of spontaneous eye movements plotted for each 30-second recording interval; the interleaved 30-second intervals with moving black and white stripes were omitted from the analysis. Spontaneous eye movements are quantified as in C. Individual symbols represent individual mice. Data are presented as the mean ± standard deviation.
Figure 6
Figure 6. BBB function assessed by OKR.
(A) Time course of the OKR response after i.p. injection of 0.5 mg/kg i.p. ivermectin in Abcb1a+/+ and Abcb1a–/– littermates. (B and C) Quantification of (B) OKR responses and (C) rotarod performance at the indicated times after 0.5 mg/kg i.p. ivermectin in Abcb1a+/+ and Abcb1a–/– littermates. Data in B and C are averages from 4 Abcb1a+/+ and 8 Abcb1a–/– mice. Scale bar: 1 mm. Data are presented as the mean ± standard deviation.
Figure 7
Figure 7. Strain differences, receptor specificity, and agonist-antagonist interactions analyzed by eye-movement analysis.
(A) Morphine (200 mg/kg, oral delivery) eliminates the OKR in C57BL/6J mice but not in 129SvEv mice. Scale bar: 0.5 mm. (B) OKR suppression by 200 mg/kg morphine is eliminated in Oprm1–/– mice but not Oprm1+/+ littermates in a C57BL/6J background. (C) Quantification of the effects of 200 mg/kg morphine on the OKR, pupil dilation, and rotarod performance in Oprm1–/– and Oprm1+/+ littermates. (D) Quantification of OKR suppression and pupil dilation in C57BL/6J and 129SvEv mice in response to 200 mg/kg morphine. (E) Naloxone blockade of morphine-induced suppression of the OKR. Time line of drug administration and OKR recordings (top). Representative OKR traces (bottom left). Quantification of ETM30 (bottom right). i.p. naloxone administered at 10 mg/kg 10 minutes before 200 mg/kg oral morphine blocked morphine-induced OKR suppression. Data in C and E are averages from 3 Oprm1–/– and Oprm1+/+ mice. Data in D are averages from 6 C57BL/6J and 4 129SvEv mice. Scale bar: 1 mm. Data are presented as the mean ± standard deviation.
Figure 8
Figure 8. Antipsychotic drug treatment model monitored by eye-movement analysis.
(A) Effect of chlorpromazine (0.5 mg/kg) and phencyclidine (10 mg/kg) on the OKR between 0 and 90 minutes after i.p. delivery. Time lines show drug injection times and OKR recording intervals for individual drug experiments (left) and combined drug experiments (right). Segments “i–vi” correspond with traces in B. (B) Beginning within 15 minutes of administration, 10 mg/kg phencyclidine produces rapid OKR-like movements independent of the visual stimulus; 0.5 mg/kg chlorpromazine has little or no effect on the OKR. Beginning approximately 60 minutes after phencyclidine injection, chlorpromazine preinjection substantially suppresses phencyclidine-induced spontaneous OKR-like movements (traces labeled “vi”). Scale bar: 0.5 mm. (C) Saccades per 30 seconds measured during the 30-second rest intervals during representative 2-hour recordings. (D) Spontaneous eye-movement traces, normalized to the saccade amplitude, for the indicated drug treatments (n > 14 saccades averaged per condition). (E) Number of saccades per 30-second interval in the presence or absence of a moving visual stimulus for the indicated drug treatments, recorded 45–90 minutes after phencyclidine administration. Data in E show averages from 3 mice per drug treatment. Data are presented as the mean ± standard deviation.
Figure 9
Figure 9. Acute lead toxicity inhibits the OKR.
(A) Representative 90-second OKR records 1 hour after the indicate dose of lead chloride delivered i.p. Five mice were tested at each dose. Scale bar: 0.5 mm. (B and C) Quantification of (B) ETM30 and (C) rotarod performance at different times before and after a single injection of 150 mg/kg lead chloride (n = 5 mice). (D) Kaplan-Meier survival curve for a single i.p. dose of lead chloride at the indicated doses (n = 10 mice per group). Data are presented as the mean ± standard deviation.
Figure 10
Figure 10. Spontaneous eye movements in a mouse model of HD.
(A) Htt R6/2 transgenic mice have spontaneous OKR-like eye movements at 8 to 12 weeks of age. Scale bar: 0.5 mm. (B) Spontaneous eye-movement traces, normalized to saccade amplitude, for the mice shown in A (n = 10 saccades for WT control and 36–40 saccades for Htt R6/2). Scale bar: 0.25 mm. (C) Clustering of saccade polarity. Black (WT) and red (Htt R6/2) lines show the number of adjacent saccades of the same polarity over a 5-minute recording interval. #182, #176, and #178 refer to individual mice. Blue lines show the calculated distributions for the same number of saccades divided equally into positive and negative polarities and randomly ordered in time. Data are presented as the mean ± standard deviation.

Similar articles

Cited by

References

    1. Kola I, Landis J. Can the pharmaceutical industry reduce attrition rates? Nat Rev Drug Discov. 2004;3(8):711–715. - PubMed
    1. Pangalos MN, Schechter LE, Hurko O. Drug development for CNS disorders: strategies for balancing risk and reducing attrition. Nat Rev Drug Discov. 2007;6(7):521–532. - PubMed
    1. McDonald K, Trick L, Boyle J. Sedation and antihistamines: an update. Review of inter-drug differences using proportional impairment ratios. Hum Psychopharmacol. 2008;23(7):555–570. doi: 10.1002/hup.962. - DOI - PubMed
    1. Brunner D, Nestler E, Leahy E. In need of high-throughput behavioral systems. Drug Discov Today. 2002;7(18 suppl):S107–S112. doi: 10.1016/S1359-6446(02)02423-6. - DOI - PubMed
    1. Reichel A. The role of blood-brain barrier studies in the pharmaceutical industry. Curr Drug Metab. 2006;7(2):183–203. - PubMed

Publication types

MeSH terms

Substances