. 2011 Sep;121(9):3735-46.
doi: 10.1172/JCI43382. Epub 2011 Aug 8.

Disruption of PPARγ/β-catenin-mediated regulation of apelin impairs BMP-induced mouse and human pulmonary arterial EC survival

Affiliations

Disruption of PPARγ/β-catenin-mediated regulation of apelin impairs BMP-induced mouse and human pulmonary arterial EC survival

Tero-Pekka Alastalo et al. J Clin Invest. 2011 Sep.

Abstract

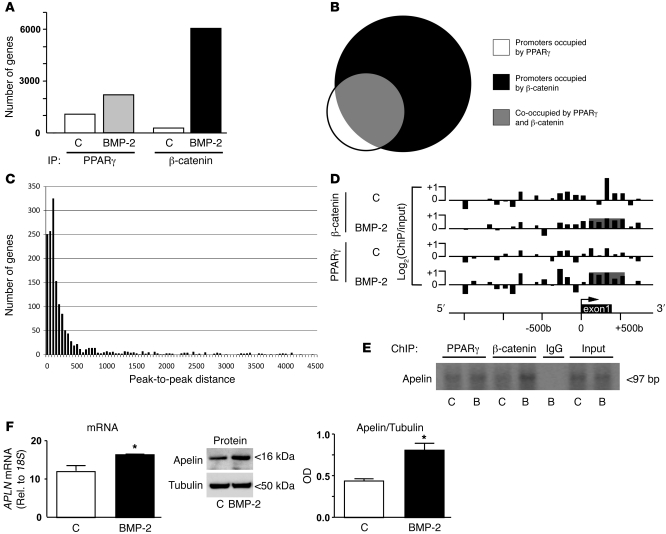
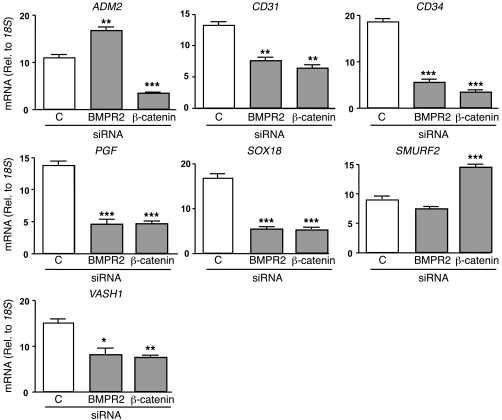
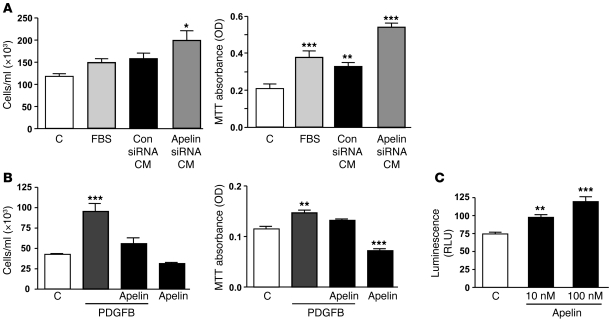
Reduced bone morphogenetic protein receptor 2 (BMPR2) expression in patients with pulmonary arterial hypertension (PAH) can impair pulmonary arterial EC (PAEC) function. This can adversely affect EC survival and promote SMC proliferation. We hypothesized that interventions to normalize expression of genes that are targets of BMPR2 signaling could restore PAEC function and prevent or reverse PAH. Here we have characterized, in human PAECs, a BMPR2-mediated transcriptional complex between PPARγ and β-catenin and shown that disruption of this complex impaired BMP-mediated PAEC survival. Using whole genome-wide ChIP-Chip promoter analysis and gene expression microarrays, we delineated PPARγ/β-catenin-dependent transcription of target genes including APLN, which encodes apelin. We documented reduced PAEC expression of apelin in PAH patients versus controls. In cell culture experiments, we showed that apelin-deficient PAECs were prone to apoptosis and promoted pulmonary arterial SMC (PASMC) proliferation. Conversely, we established that apelin, like BMPR2 ligands, suppressed proliferation and induced apoptosis of PASMCs. Consistent with these functions, administration of apelin reversed PAH in mice with reduced production of apelin resulting from deletion of PPARγ in ECs. Taken together, our findings suggest that apelin could be effective in treating PAH by rescuing BMPR2 and PAEC dysfunction.


Figures

Figure 1
Figure 1. PPARγ ligands abrogate BMP-2–mediated survival and inhibit BMP-2–mediated interaction between PPARγ and β-catenin in PAECs.
(A) Cell counts were used to determine PAEC and PMVEC survival after 24 hours under serum-free (SF) conditions. Equal numbers of cells were pretreated for 1 hour with DMSO (D; 1:10,000), GW9662 (G; 1 μM), or rosiglitazone (R; 1 μM) before stimulation with vehicle control (C) or BMP-2 (10 ng/ml). Bars represent mean ± SEM from 3 separate experiments with 3 replicates per condition. (B) Western immunoblot and densitometric analysis of β-catenin levels after IP with the PPARγ Ab in response to BMP-2. (C) Western immunoblot of β-catenin IP with PPARγ Ab under conditions in A. (D) β-catenin in nuclear extracts after IP with PPARγ Ab. In BD, loading control shows β-catenin in lysates before IP. Bars represent mean ± SEM from 3 separate experiments. *P < 0.05, **P < 0.01, ***P < 0.001 vs. control; #P < 0.05, ##P < 0.01, ###P < 0.001 vs. DMSO; 1-way ANOVA with Bonferroni multiple comparison test.
Figure 2
Figure 2. NO2-FA promotion of survival and induction of PPARγ/β-catenin complex formation in PAECs.
(A) Cell counts were used to determine PAEC survival after 24 hours under SF conditions. Equal numbers of cells were pretreated for 1 hour with 1 μM NO2-FA or methanol as vehicle (V) before stimulation with BMP-2 (10 ng/ml) or water as control. Bars represent mean ± SEM from 3 separate experiments with 3 replicates per condition. (B) Western immunoblot and densitometric analysis of β-catenin levels after IP with PPARγ Ab in response to NO2-FA, BMP-2, or the combination. Loading control with α-tubulin showed equal loading of protein lysate before IP reaction. Bars represent mean ± SEM from 3 separate experiments. *P < 0.05, ***P < 0.001 vs. control, 1-way ANOVA with Bonferroni multiple comparison test (A) or unpaired 2-tailed t test (B).
Figure 3
Figure 3. Microarray strategies reveal apelin as a target of BMP signaling and of the PPARγ/β-catenin complex.
(A) Number of significant peaks (FDR < 0.20) in PPARγ and β-catenin ChIP-chip assays determined by NimbleScan in PAECs treated for 4 hours with vehicle control or BMP-2 (10 ng/ml). (B) Co-occupancy of β-catenin in PPARγ-bound promoter in BMP-2–treated samples. (C) Peak-to-peak analysis of co-occupied genes in BMP-2–treated samples. (D) Occupancy of PPARγ or β-catenin across approximately 2 kb of the APLN gene, as measured by ChIP-chip in vehicle control– and BMP-2–treated PAECs. The y axis plots the ratio of hybridization signals of ChIP over input genomic DNA in log2 space. Shaded gray region denotes significant peaks, as determined by NimbleScan. (E) ChIP-PCR with primers targeted against the ChIP-chip peak was performed for PPARγ, β-catenin, or IgG ChIPs with PAECs treated with vehicle control or BMP-2 (B). The PCR products were run on a 2% agarose gel. Input samples were used as a positive control. (F) PAECs were stimulated for 8 hours with vehicle control or BMP-2 (10 ng/ml), and expression of APLN mRNA and apelin protein was analyzed. Bars represent mean ± SEM from 3 separate experiments. *P < 0.05, unpaired 2-tailed t test.
Figure 4
Figure 4. Confirmation of gene expression changes suggested by microarray.
Of the genes listed in Supplemental Table 3, we selected 7 for qRT-PCR. Bars represent mean ± SEM from 3 separate experiments. *P < 0.05, **P < 0.01, ***P < 0.001 vs. control siRNA, 1-way ANOVA with Bonferroni multiple comparison test.
Figure 5
Figure 5. Loss of BMPR2, PPARγ, or β-catenin leads to decreased apelin expression.
Levels of (A) APLN mRNA and (B) apelin protein after silencing BMPR2 or β-catenin with siRNA. Bars represent mean ± SEM from 3 separate experiments. (C) Apelin protein levels in lungs from WT and TIE2CrePPARγfl/fl (KO) mice. Bars represent mean ± SEM from 3 separate animals per group. (D) Apln mRNA levels in mouse PMVECs at passage 1. Bars represents mean ± SEM in PMVECs harvested from 4 animals per group. (E) Apelin protein levels in mouse WT and TIE2CrePPARγfl/fl PMVECs. Bars represent mean ± SEM from PMVEC cultures harvested from 4 different animals. *P < 0.05, **P < 0.01, ***P < 0.001 vs. respective control, 1-way ANOVA with Bonferroni multiple comparison test (A and B) or unpaired 2-tailed t test (CE).
Figure 6
Figure 6. Decreased apelin expression in the endothelium of IPAH patients.
(A) IHC in serial lung tissue sections from representative unused-donor control and IPAH patient lungs stained with Abs against apelin. Preincubation of Ab with apelin peptide was used as a specificity control. Higher-magnification endothelium in insets demonstrates greater apelin immunoreactivity in the control vessel. Scale bars: 100 μm. Original magnification, x200 (insets, ×630). (B) BMPR2 protein levels in PMVECs from control and IPAH patients. (C) APLN mRNA and (D) apelin protein expression in PMVECs from B. (BD) Bars represent mean ± SEM from PMVECs isolated from 3 different patients per group. *P < 0.05, **P < 0.01 vs. control, unpaired 2-tailed t test.
Figure 7
Figure 7. Apelin promotes PAEC survival.
(A) Caspase 3/7 activity was used to measure the level of apoptosis in PAECs exposed for 24 hours to SF medium in the presence of vehicle control, apelin (100 nM), or VEGFA (50 ng/ml). (B) PAEC survival under these conditions was also determined by cell count and MTT analyses. (C) Survival in the presence of apelin was also assessed by cell counts in PMVECs isolated from control and IPAH patients. (D) Apoptosis level in control siRNA– and apelin siRNA–treated PAECs, as determined by caspase 3/7 assay under SF conditions. (E) Survival of apelin-deficient PAECs was determined by cell count after 24 hours of exposure to SF conditions. Baseline represents cell number before switching to SF medium. Bars represent mean ± SEM from 3 separate experiments with 6 replicates per condition in A and D and 3 replicates per condition in B, C, and E. *P < 0.05, **P < 0.01, ***P < 0.001 vs. respective control, 1-way ANOVA with Bonferroni multiple comparison test.
Figure 8
Figure 8. Apelin deficiency in PAECs contributes to PASMC proliferation.
(A) PAEC-conditioned media (CM) after treatment with control or apelin siRNA (see Methods) was used to stimulate PASMCs for 72 hours, and proliferation was analyzed by cell counts and MTT assay. 5% FBS was used as a positive control, and starvation media alone was used as a baseline control. (B) Effect of 100 nM apelin on 20 ng/ml PDGFB–mediated PASMC proliferation, analyzed by cell counts and MTT assays at 72 hours. (C) Caspase 3/7 assay to measure apoptosis in PASMCs exposed to 10 or 100 nM apelin under SF conditions for 48 hours. Bars represent mean ± SEM from 3 separate experiments with 6 replicates per condition. *P < 0.05, **P < 0.01, ***P < 0.001 vs. respective baseline control, 1-way ANOVA with Bonferroni multiple comparison test.
Figure 9
Figure 9. Apelin replacement reverses PAH in TIE2CrePPARγfl/fl mice.
(A) RV systolic pressure (RVSP) measurement of WT or TIE2CrePPARγfl/fl mice treated with PBS vehicle control or apelin (200 μg/kg). (B) RV mass, measured as a ratio of the RV to that of the LV plus septum (RV/LV+S). (C) Muscularization of alveolar wall arteries is shown as a percentage of muscularized arteries from all 15- to 50-μm-diameter arteries. Bars represent mean ± SEM from 7 (A and B) or 5 (C) animals per group. (D) Representative anti–αSMC-actin (Actin) and Movat pentachrome–stained sections of pulmonary arteries, demonstrating reduced muscularization of pulmonary arteries in apelin-treated TIE2CrePPARγfl/fl mice. Scale bar: 50 μm. Original magnification, ×400. **P < 0.01, ***P < 0.001 vs. WT control, #P < 0.05, ###P < 0.001 vs. untreated TIE2CrePPARγfl/fl control, 1-way ANOVA with Bonferroni multiple comparison test.

Similar articles

Cited by

References

    1. Masri FA, et al. Hyperproliferative apoptosis-resistant endothelial cells in idiopathic pulmonary arterial hypertension. Am J Physiol Lung Cell Mol Physiol. 2007;293(3):L548–L554. doi: 10.1152/ajplung.00428.2006. - DOI - PubMed
    1. Deng Z, et al. Familial primary pulmonary hypertension (gene PPH1) is caused by mutations in the bone morphogenetic protein receptor-II gene. Am J Hum Genet. 2000;67(3):737–744. doi: 10.1086/303059. - DOI - PMC - PubMed
    1. Lane KB, et al. Heterozygous germline mutations in BMPR2, encoding a TGF-beta receptor, cause familial primary pulmonary hypertension. Nat Genet. 2000;26(1):81–84. doi: 10.1038/79226. - DOI - PubMed
    1. Du L, et al. Signaling molecules in nonfamilial pulmonary hypertension. N Engl J Med. 2003;348(6):500–509. doi: 10.1056/NEJMoa021650. - DOI - PubMed
    1. Atkinson C, et al. Primary pulmonary hypertension is associated with reduced pulmonary vascular expression of type II bone morphogenetic protein receptor. Circulation. 2002;105(14):1672–1678. doi: 10.1161/01.CIR.0000012754.72951.3D. - DOI - PubMed

Publication types

MeSH terms