. 2011 Aug 7;13(9):1108-15.
doi: 10.1038/ncb2310.

RALA and RALBP1 regulate mitochondrial fission at mitosis

Affiliations

RALA and RALBP1 regulate mitochondrial fission at mitosis

David F Kashatus et al. Nat Cell Biol. .

Abstract

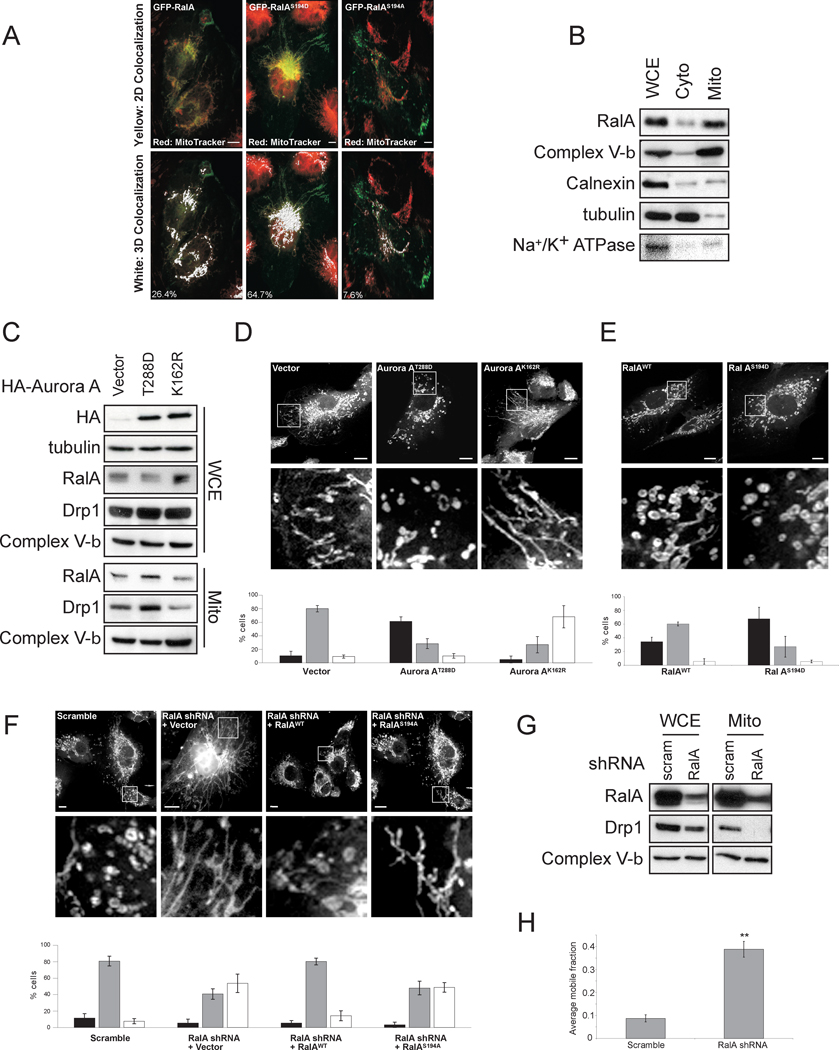
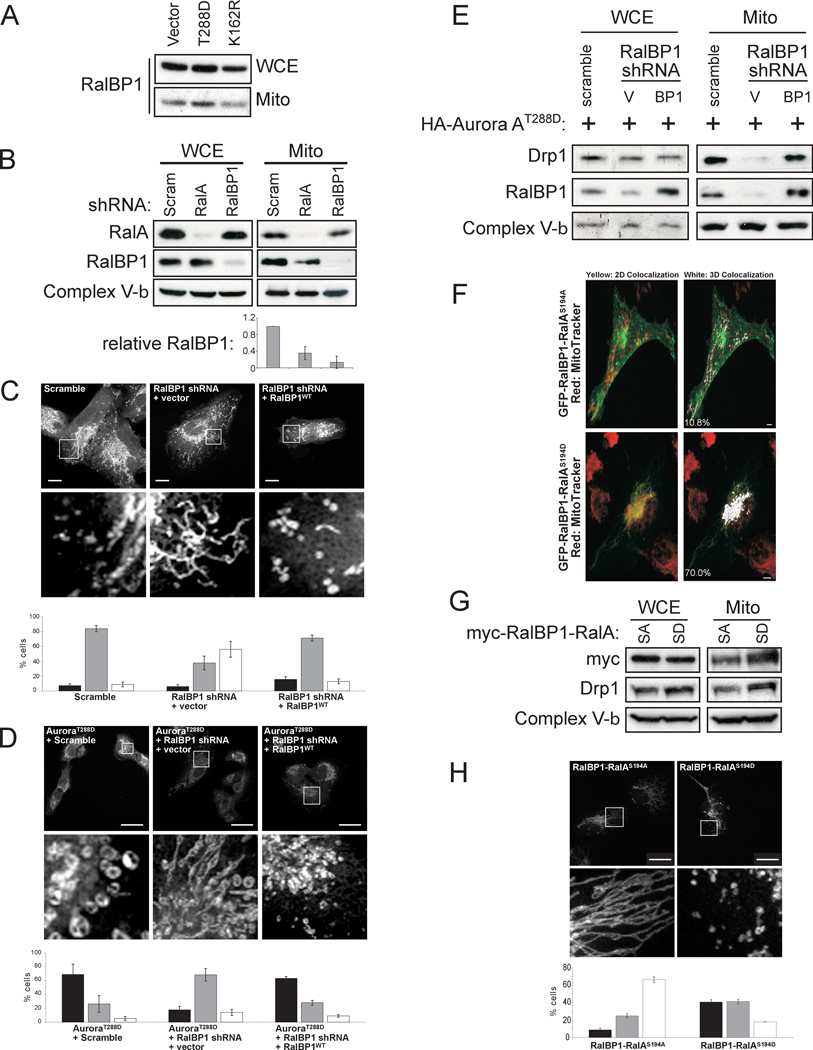
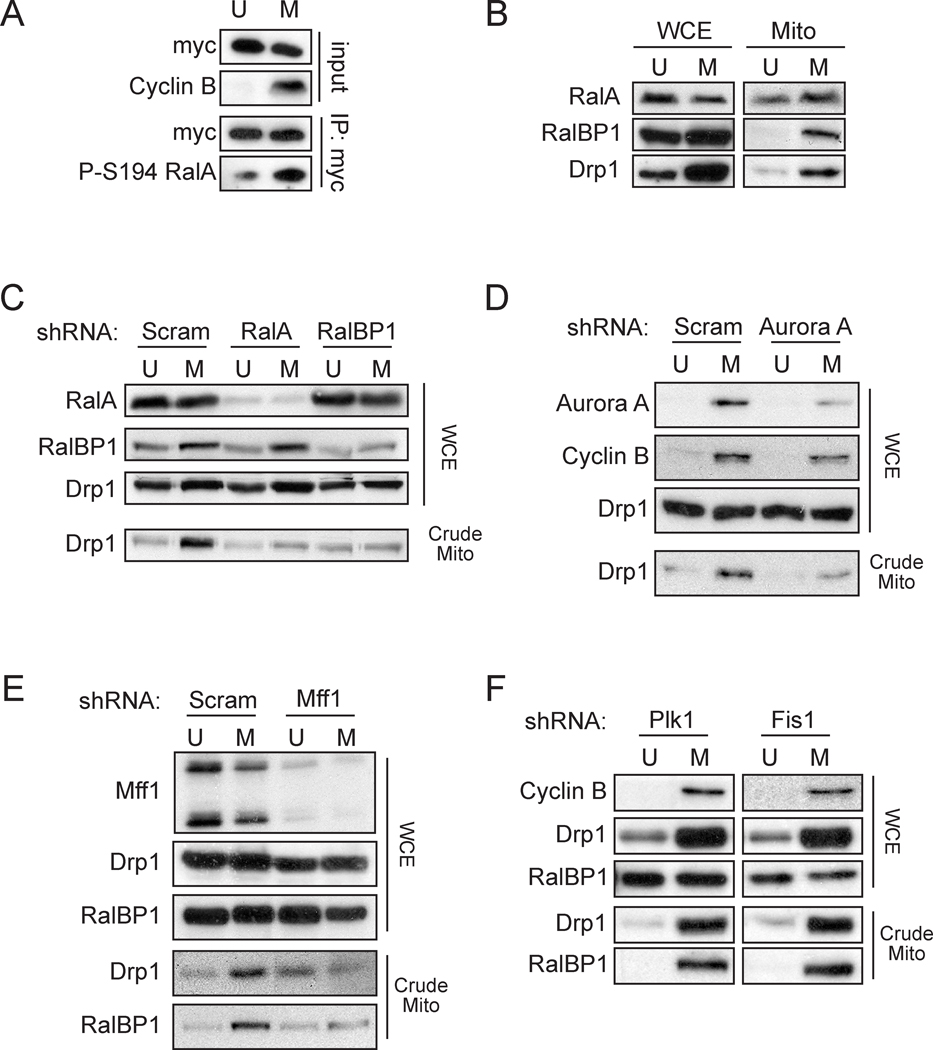
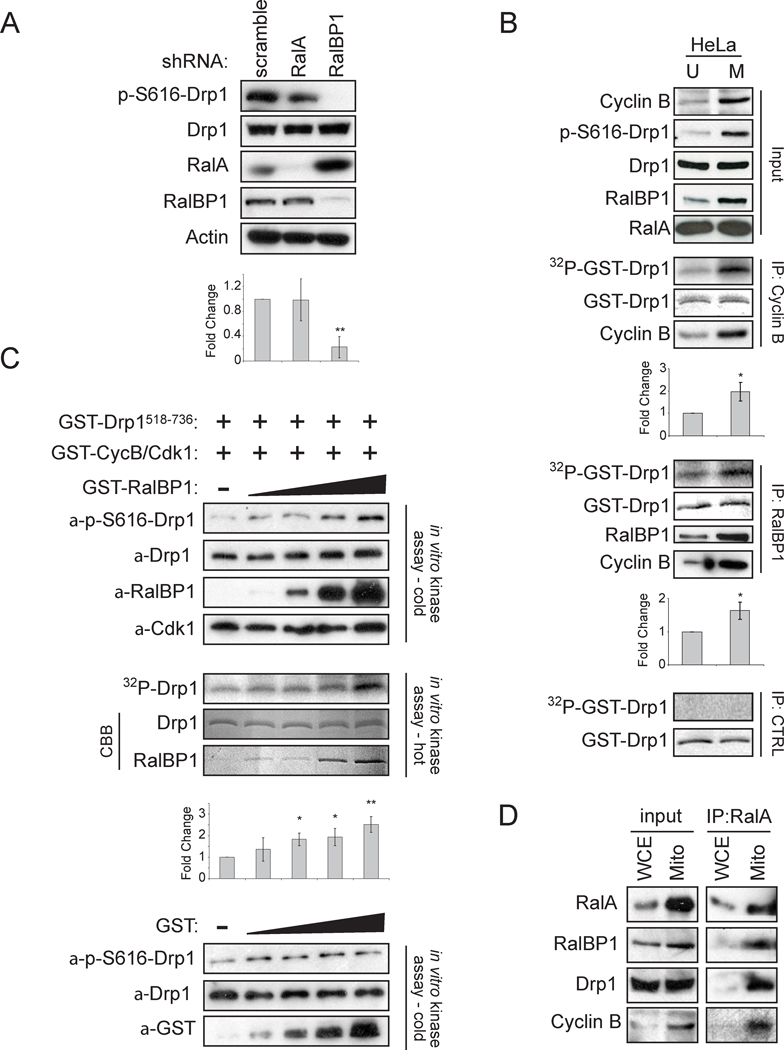
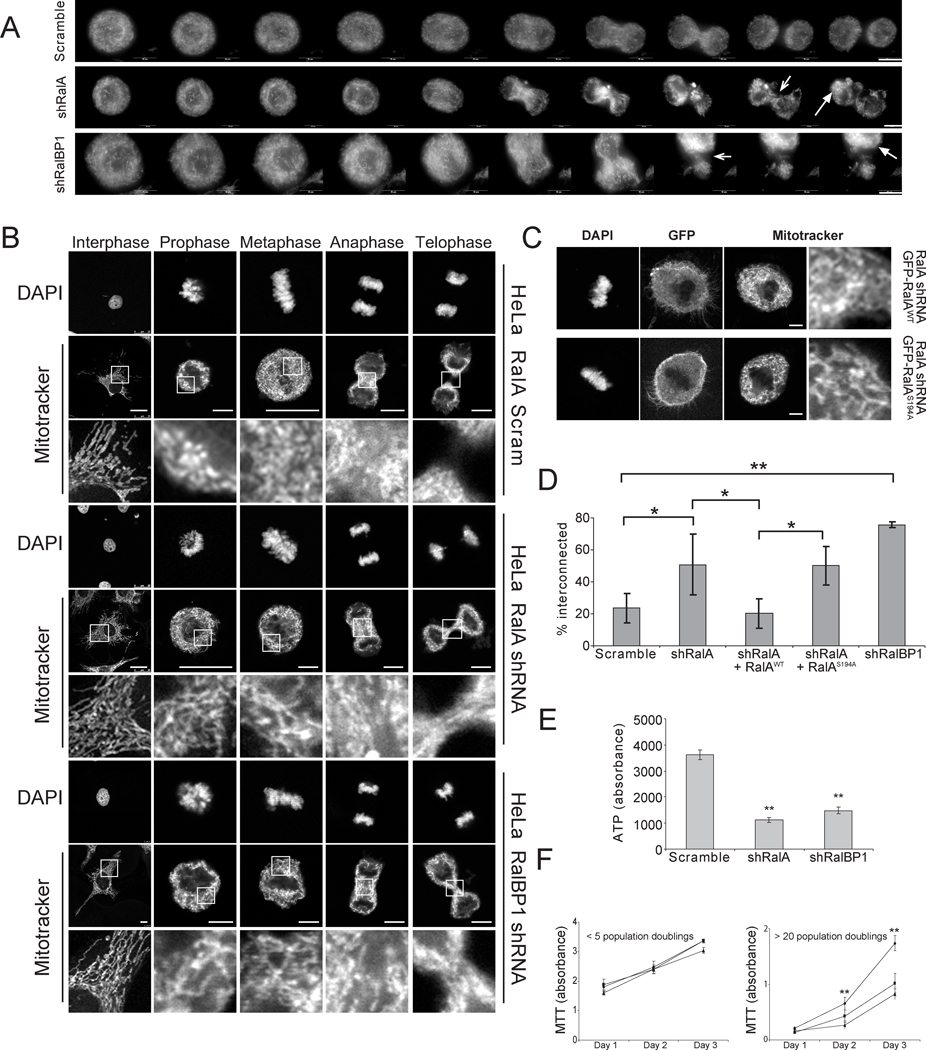
Mitochondria exist as dynamic interconnected networks that are maintained through a balance of fusion and fission. Equal distribution of mitochondria to daughter cells during mitosis requires fission. Mitotic mitochondrial fission depends on both the relocalization of the large GTPase DRP1 to the outer mitochondrial membrane and phosphorylation of Ser 616 on DRP1 by the mitotic kinase cyclin B-CDK1 (ref. 2). We now report that these processes are mediated by the small Ras-like GTPase RALA and its effector RALBP1 (also known as RLIP76, RLIP1 or RIP1; refs 3, 4). Specifically, the mitotic kinase Aurora A phosphorylates Ser 194 of RALA, relocalizing it to the mitochondria, where it concentrates RALBP1 and DRP1. Furthermore, RALBP1 is associated with cyclin B-CDK1 kinase activity that leads to phosphorylation of DRP1 on Ser 616. Disrupting either RALA or RALBP1 leads to a loss of mitochondrial fission at mitosis, improper segregation of mitochondria during cytokinesis and a decrease in ATP levels and cell number. Thus, the two mitotic kinases Aurora A and cyclin B-CDK1 converge on RALA and RALBP1 to promote mitochondrial fission, the appropriate distribution of mitochondria to daughter cells and ultimately proper mitochondrial function.


Figures

Figure 1
Figure 1
Aurora A promotes RalA mitochondrial localization and fission. A HEK-TtH cells stably expressing GFP-tagged RalA, RalAS194D or RalAS194A were incubated with MitoTracker red to visualize mitochondria. GFP-RalA (green) and mitochondria (red) were visualized using confocal microscopy. A merge (yellow, 2D colocalization) and surface rendering (white, 3D co-localization) of the co-localization of GFP-RalA with mitochondria was determined with Imaris software. The percentage of GFP protein co-localized with MitoTracker red was quantified by calculating the total of the intensity sum per object for the co-localized image divided by the total of the intensity sum per object for the GFP image. (scale bar = 5µm). B,C,G Immunoblot analysis of RalA and Drp1 levels in highly enriched mitochondrial fraction (mito), whole cell extracts (WCE) and when tested, cytoplasmic fraction (cyto) isolated from HEK-TtH cells expressing B no transgene, C vector, Aurora AT288D or Aurora AK162R or G scramble or RalA shRNA. Complex V-β (mitochondria), calnexin (ER), Na+/K+ ATPase (plasma membrane) and tubulin (cytoplasm) were analyzed to assess purity. Representative of 3 experiments. D,E,F Mitochondrial morphology visualized by MitoTracker Red staining of HEK-TtH cells expressing the indicated shRNAs and/or transgenes. Graph: % of cells (mean ± SD) exhibiting highly fragmented (■), intermediate (■) or highly interconnected (□) mitochondrial morphologies from 3 independent experiments (>100 cells). (scale bar = 5µm). H Mitochondrial network connectivity in HEK-TtH cells expressing scramble or RalA shRNA and transfected with mito-YFP. The normalized and photobleach corrected mobile fractions represent the mean ± SEM of 30 individual FRAP curves (** p = 2.02 × 10⁻⁸).
Figure 2
Figure 2
RalBP1 promotes mitochondrial fragmentation. A,B,E,G Immunoblot analysis of RalA, RalBP1 or Drp1 levels in highly enriched mitochondrial fraction (mito) and whole cell extracts (WCE) isolated from HEK-TtH cells expressing A vector, Aurora AT288D or Aurora AK162R, B scramble control (scram), RalA shRNA or RalBP1 shRNA E Aurora AT288D plus either scramble control or RalBP1 shRNA complemented with vector (V) or shRNA-resistant RalBP1 (BP1) or G myc-RalBP1-RalAS194A or myc-RalBP1-RalAS194D. Complex V-β (mitochondria) was analyzed to assess purity. Representative of 3 experiments. C,D,H Mitochondrial morphology visualized by MitoTracker Red staining of C HEK-TtH cells, D HEK-TtH cells expressing active Aurora AT288D and a scramble sequence or RalBP1 shRNAs alone or in conjunction with shRNA-resistant wild type RalBP1 or H HEK-TtH cells expressing Myc-RalBP1-RalAS194A or Myc-RalBP1-RalAS194D. Graph: % of cells (mean ± SD) exhibiting highly fragmented (■), intermediate (■) or highly interconnected (□) mitochondrial morphologies from 3 independent experiments (>100 cells) (scale bar = C 5µm D,H 25µm). F Overlap (merge, yellow) of the distribution of GFP-RalBP1-RalAS194A or GFP-RalBP1-RalAS194D, as detected by immunofluoresence of GFP (green), and MitoTracker red-positive mitochondria (red) in HEK-TtH cells. Surface rendering of the co-localization of GFP-RalBP1-RalA fusion proteins with mitochondria (white) was determined with Imaris software. The percentage of GFP protein co-localized with mitotracker red was quantified by calculating the total of the intensity sum per object for the co-localized image divided by the total of the intensity sum per object for the GFP image. (scale bar = 5µm for SD or 3µm for SA).
Figure 3
Figure 3
RalA and RalBP1 promote mitochondrial localization Drp1. A Extracts isolated from HeLa cells expressing myc-RalA, either unsynchronized (U) or synchronized in mitosis (M) using double thymidine block were either analyzed by immunoblot for levels of myc-RalA and cyclin B or subjected to immunoprecipitation (IP) with antibodies against myc and analyzed by immunoblot for levels of myc-RalA or phospho-S194 RalA. Representative of 3 experiments. B Immunoblot analysis of RalA, RalBP1 and Drp1 levels in mitochondrial fractions (mito) and whole cell extracts (WCE) isolated from HeLa cells either unsynchronized (U) or synchronized in mitosis (M) using double thymidine block. Representative of 3 experiments. C–F Immunoblot analysis of RalA, RalBP1, Drp1, Cyclin B, Aurora A and Mff1 levels in crude mitochondrial fractions (mito) and whole cell extracts (WCE) isolated from HeLa cells, either unsynchronized (U) or synchronized in mitosis (M) using double thymidine block, and expressing C scramble control, RalA shRNA or RaBP1 shRNA or D doxycycline inducible scramble control or Aurora A shRNA E scramble control or Mff1 shRNA or F Plk1 or Fis1 shRNA. Representative of 3 experiments.
Figure 4
Figure 4
RalBP1 promotes phosphorylation of Drp1. A Immunoblot analysis of S616 phosphorylated (p-S616-Drp1), Drp1, RalA, RalBP1 and actin levels in HeLa cells expressing a scramble control, RalA shRNA or RalBP1 shRNA. Graph represents mean p-S616-Drp1 signal intensity measured by imageJ from 3 experiments +/− SD (** p = 0.008). B Extracts isolated from HeLa cells, either unsynchronized (U) or synchronized in mitosis (M) using double thymidine block were either analyzed by immunoblot for levels of RalA, Drp1, cyclin B or S616 phosphorylated Drp1, or subjected to immunoprecipitation (IP) with either no antibody or antibodies against cyclin B or RalBP1, followed by incubation with GST-Drp1 and γ32P-ATP, and resolved on an acrylamide gel. 32P-labeled GST-Drp1 was visualized by phosphorimager while total GST-Drp1 was visualized by coomassie brilliant blue staining. Graphs represent mean 32P-GST-Drp1 signal intensity measured by imageJ from 3 experiments +/− SD (* p = 0.028 for Cyclin B, 0.027 for RalBP1). C 200ng GST-Drp1 and 25ng GST-Cyclin B/Cdk1 were incubated with increasing amounts of either GST-RalBP1 or GST (0, 125, 250, 500, 1000ng) in addition to either ATP or γ32P-ATP. Reactions were resolved by SDS-PAGE and either subjected to immunoblot for Drp1, RalBP1 and S585 phosphorylated Drp1 (cold kinase assay) or visualized by phosphorimager (hot kinase assay). GST, GST-Drp1 and GST-RalBP1 were visualized by coomassie brilliant blue staining (CBB). Graph represents mean p-S616-Drp1 signal intensity measured by imageJ from 3 experiments +/− SD (* p = 0.020, 0.028 ** p = 0.009). D Immunoblot analysis of RalA, RalBP1, Drp1 and Cyclin B levels in crude mitochondrial fractions (mito) and whole cell extracts (WCE) isolated from HeLa cells synchronized in mitosis (M) using double thymidine block, treated with DSP, and subjected to immunoprecipitation with and anti-RalA antibody.
Figure 5
Figure 5
Knockdown of RalA or RalBP1 prevents mitosis-induced mitochondrial fission. A Mitochondrial morphology as visualized by live cell imaging of HeLa cells stably expressing RFP-Mito and scramble control, RalA shRNA or RalBP1 shRNA after release from double thymidine block. Arrows (1, 2) indicate regions of mitochondria retained during telophase and (3, 4) unequal distribution of mitochondria to daughter cells (scale bar = 10µm). B Mitochondrial morphology visualized by MitoTracker Red staining of HeLa cells expressing a scramble control, RalA shRNA or RalBP1 shRNA at the indicated phases of mitosis upon being synchronized in mitosis using double thymidine block. DAPI staining was used to assign mitotic phase (scale bar = 25µm for scram interphase and metaphase and RalA interphase and prophase, 10µm for scram anaphase and telophase and RalBP1 interphase and 7.5µm for all other images). C Mitochondrial morphology HeLa cells expressing RalA shRNA complemented with GFP-tagged, shRNA resistant RalA in the wild type (WT) or S194A mutant configuration and captured at metaphase (DAPI) (scale bar = 10µm). D Quantitation of the percent of cells (mean ± SD, n = 3 independent experiments with ≥ 30 cells analyzed per condition) exhibiting mitochondrial elongation during metaphase. (* p ≤ 0.05, ** p ≤ 0.01) E ATP production of HeLa cells stably expressing scramble, RalA or RalPB1 shRNA was determined by measuring ATP-dependent luciferase activity measured at 560nm on a Victor luminometer. (The experiments were repeated at least 3 times, and each time the error was calculated from 12 replicates, ** p = 1.6 × 10⁻⁷ for RalA, 5.3 × 10⁻⁷ for RalBP1). F Proliferation of HeLa cells stably expressing scramble (◆), RalA (■) or RalBP1 (▲) as measured by MTT assay. Measurements were performed over three days using cells with fewer than 5 or greater than 20 population doublings following selection for the transgene. (The experiments were repeated at least 3 times, and each time the error was calculated from 16 replicates; day 2: ** p = 4.5 × 10⁻⁵ for RalA, 6.3 × 10⁻⁵ for RalBP1, day 3: ** p = 4.5 × 10⁻⁸ for RalA, 2.7 × 10⁻⁶ for RalBP1)

Comment in

Similar articles

Cited by

References

    1. Detmer SA, Chan DC. Functions and dysfunctions of mitochondrial dynamics. Nat Rev Mol Cell Biol. 2007;8:870–879. - PubMed
    1. Taguchi N, Ishihara N, Jofuku A, Oka T, Mihara K. Mitotic phosphorylation of dynamin-related GTPase Drp1 participates in mitochondrial fission. J. Biol. Chem. 2007;282:11521–11529. - PubMed
    1. Camonis JH, White MA. Ral GTPases: corrupting the exocyst in cancer cells. Trends Cell Biol. 2005;15:327–332. - PubMed
    1. Feig LA. Ral-GTPases: approaching their 15 minutes of fame. Trends Cell Biol. 2003;13:419–425. - PubMed
    1. Wu JC, et al. Identification of V23RalA-Ser194 as a critical mediator for Aurora-A-induced cellular motility and transformation by small pool expression screening. J. Biol. Chem. 2005;280:9013–9022. - PubMed

Publication types

MeSH terms