Comparative Study
. 2011 Aug 7;17(9):1109-15.
doi: 10.1038/nm.2416.

Postpartum mammary gland involution drives progression of ductal carcinoma in situ through collagen and COX-2

Affiliations
Comparative Study

Postpartum mammary gland involution drives progression of ductal carcinoma in situ through collagen and COX-2

Traci R Lyons et al. Nat Med. .

Abstract

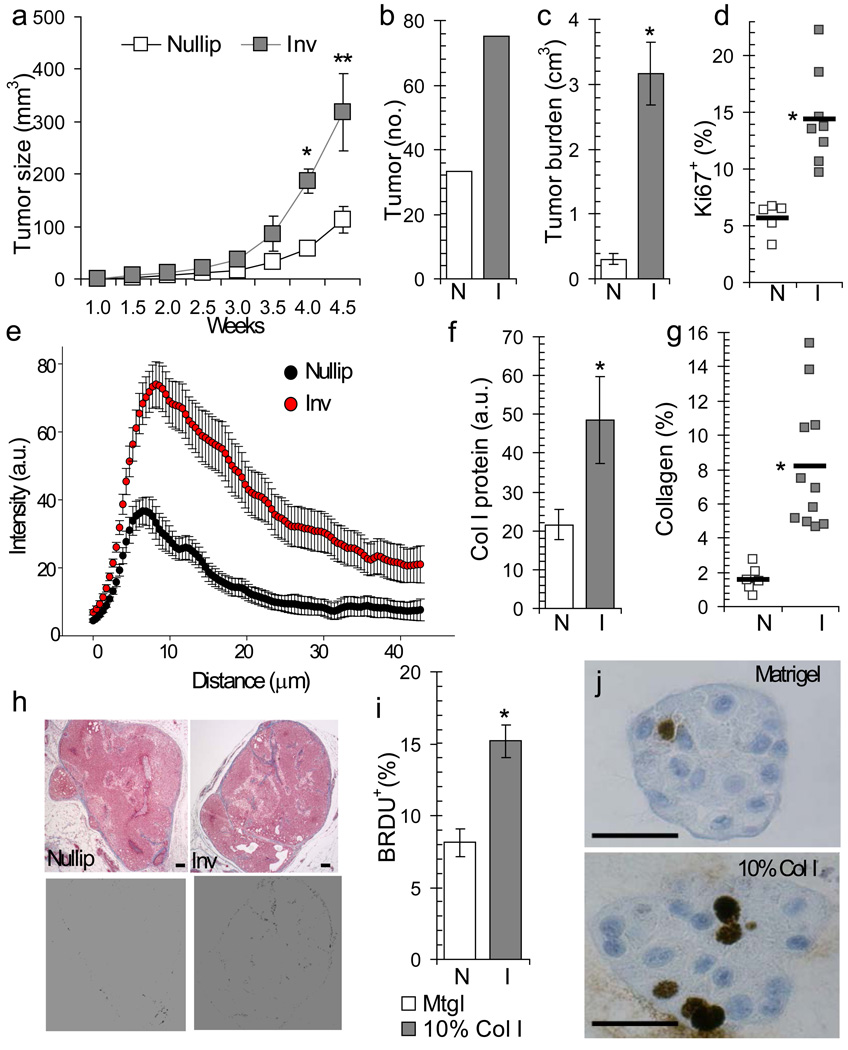
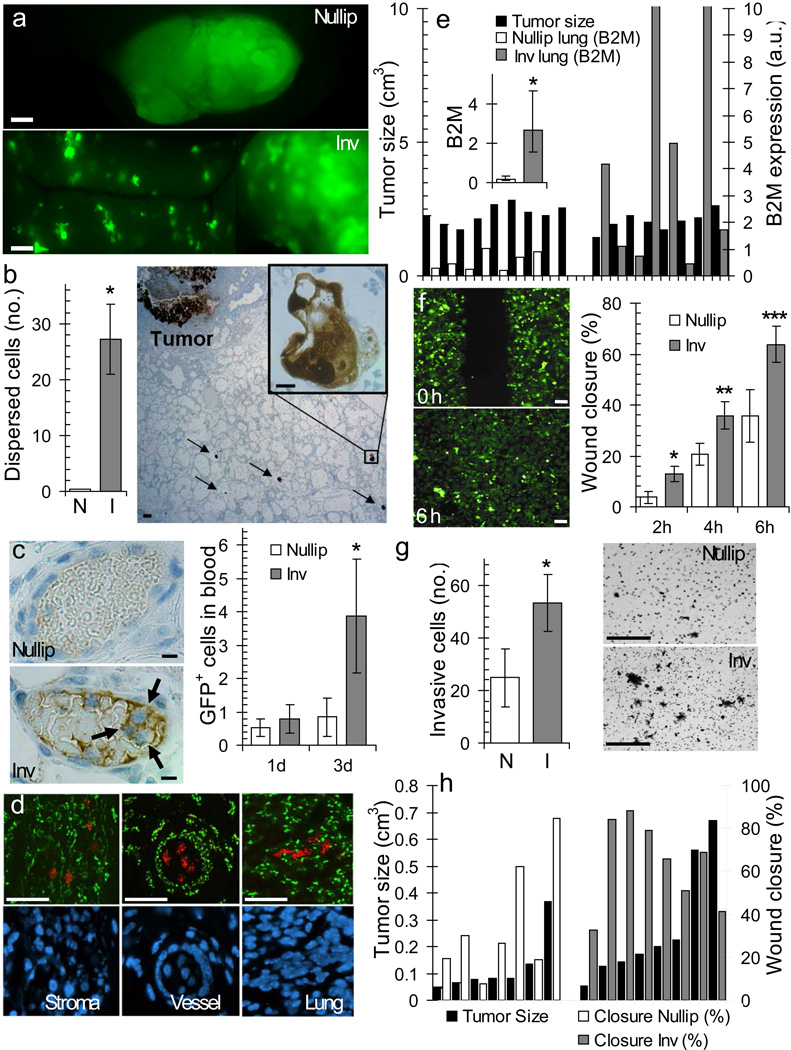
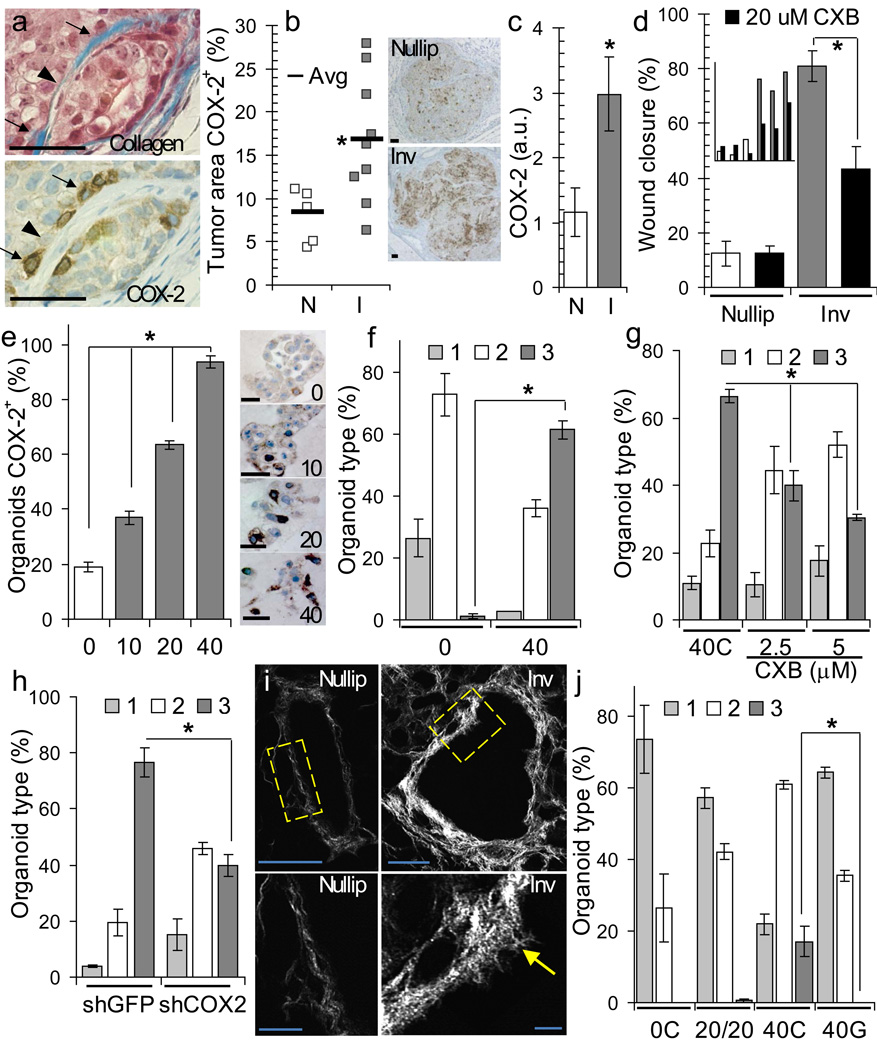
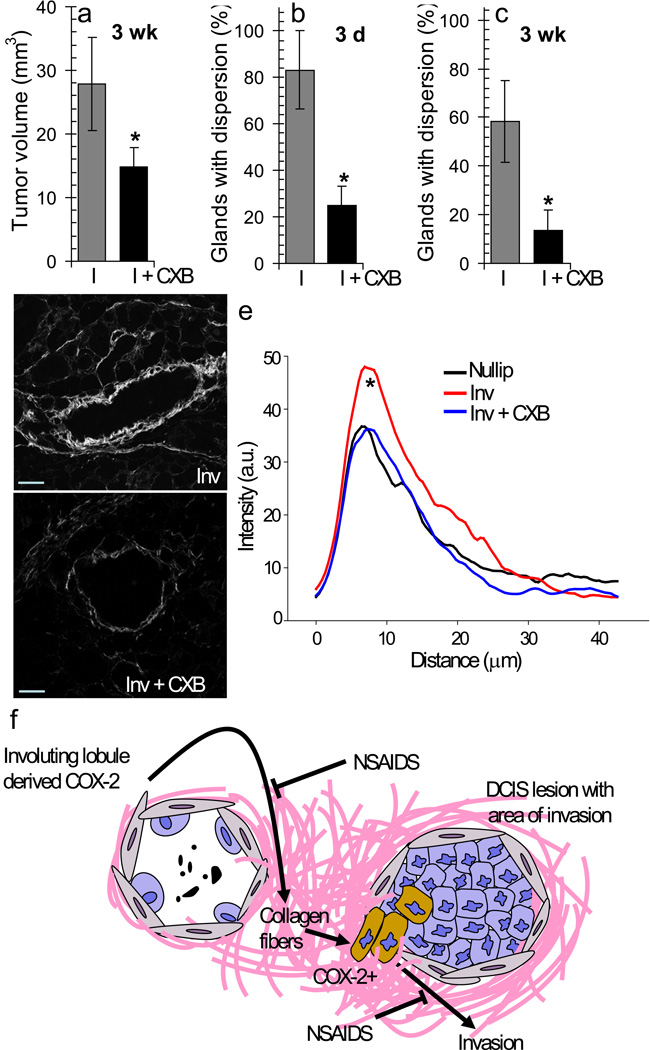
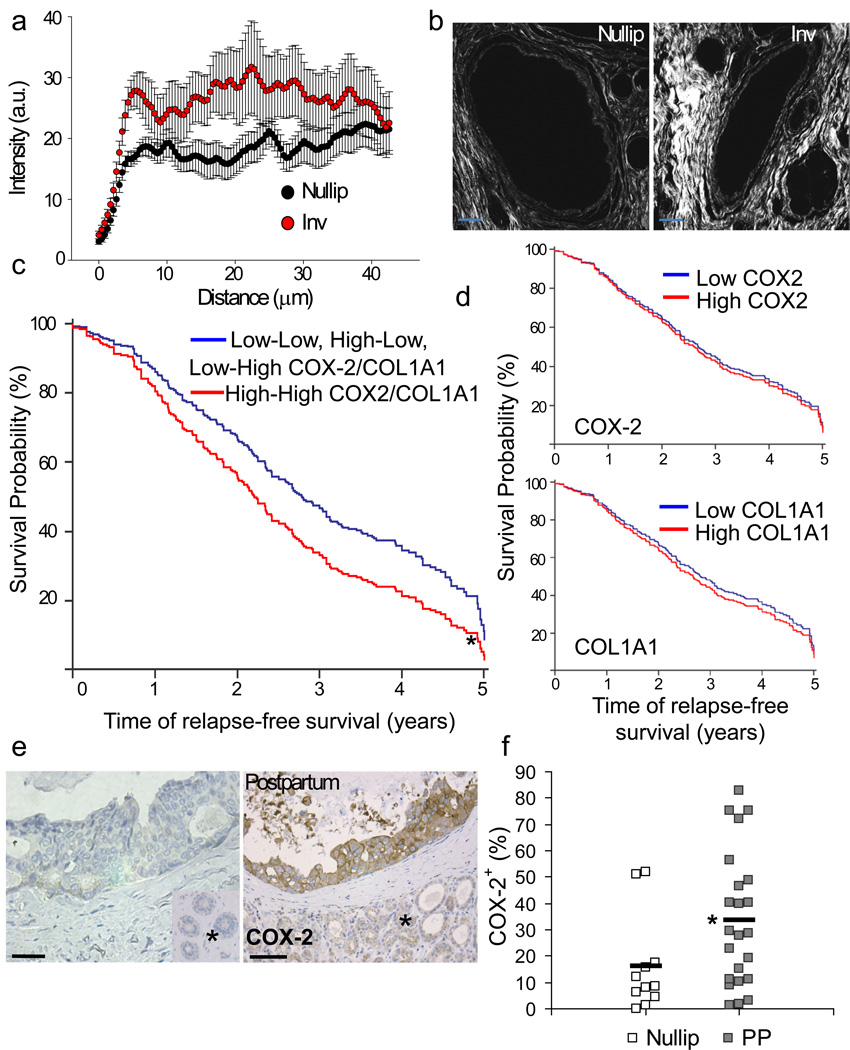
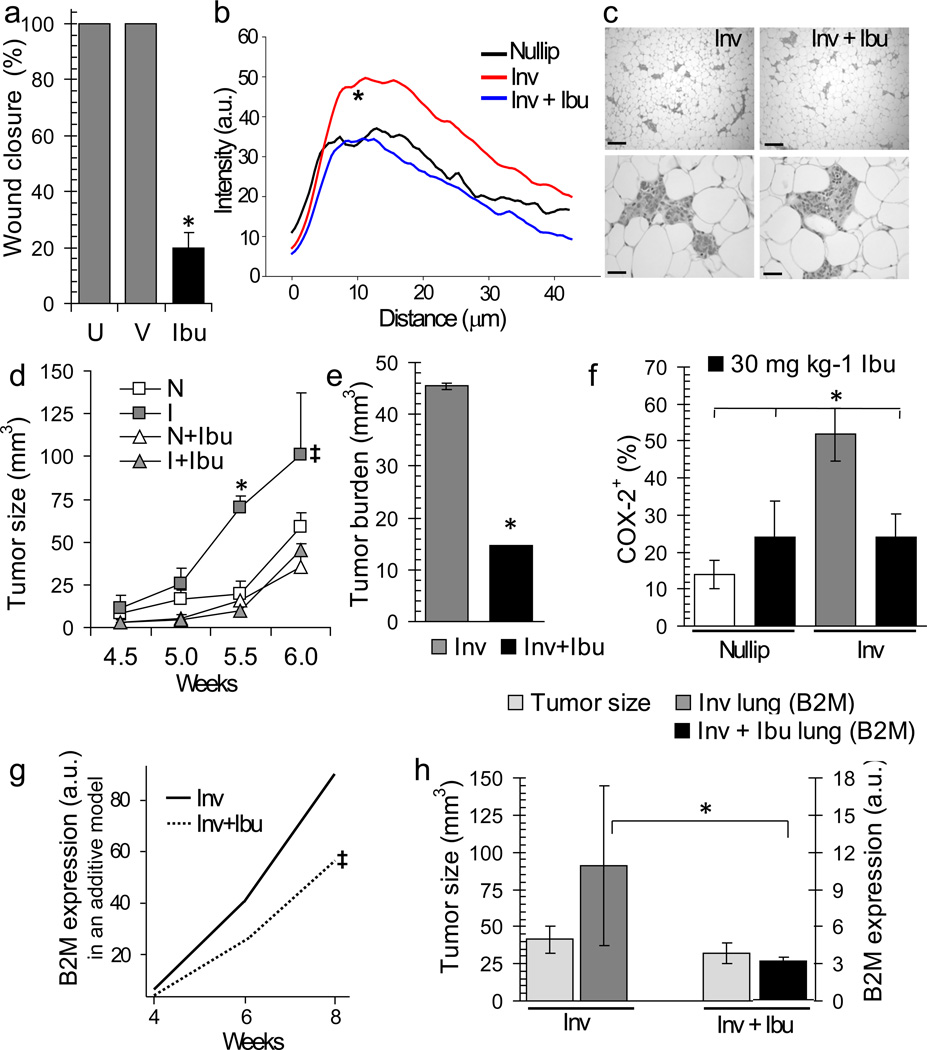
The prognosis of breast cancer in young women is influenced by reproductive history. Women diagnosed within 5 years postpartum have worse prognosis than nulliparous women or women diagnosed during pregnancy. Here we describe a mouse model of postpartum breast cancer that identifies mammary gland involution as a driving force of tumor progression. In this model, human breast cancer cells exposed to the involuting mammary microenvironment form large tumors that are characterized by abundant fibrillar collagen, high cyclooxygenase-2 (COX-2) expression and an invasive phenotype. In culture, tumor cells are invasive in a fibrillar collagen and COX-2-dependent manner. In the involuting mammary gland, inhibition of COX-2 reduces the collagen fibrillogenesis associated with involution, as well as tumor growth and tumor cell infiltration to the lung. These data support further research to determine whether women at high risk for postpartum breast cancer would benefit from treatment with nonsteroidal anti-inflammatory drugs (NSAIDs) during postpartum involution.


Figures

Figure 1
Figure 1. Postpartum mammary microenvironment promotes tumor growth in a mammary fat pad xenograft model
(a) Average primary tumor volume, *p=0.001, **p=0.0174, n=7 (nulliparous), n=6 (involution), unpaired t test. (b) Total tumor number per group at 4 weeks post-injection, n=9 (nulliparous) and n=8 (involution). (c) Average tumor burden (total tumor volume per injected gland) 4 weeks post-injection, *p=0.0011, n=15 (nulliparous), n=13 (involution), unpaired t test. (d) Average percent tumor area positive for Ki67, *p=0.0009, n=5 (nulliparous), n=8 (involution), unpaired t test. (e) Collagen intensity measured by Second Harmonic Generation (SHG) imaging versus distance from involuting mouse mammary ducts (red, n=17 ducts, 3 mice) compared to nulliparous (black, n=12 ducts, 3 mice), p<0.00001, student’s t test. (f) Western blot for Collagen I in mouse mammary tissue lysates, *p=0.042, n=3 per group, unpaired t test. (g) Percent tumor area positive for collagen by trichrome stain, *p=0.0002, n=6 (nulliparous), n=11 (involution), unpaired t test. (h) Top, trichrome stained tumor images, blue=collagen. Bottom, blue signal converted to black, scalebar=100 µm. (i) Percent BRDU+ cells in 3D culture on Matrigel or 10% collagen I, *p<0.0001, unpaired t test, n=30 100X fields per group. (j) BRDU IHC images of 3D organoids, scalebar=50 µm. N=nullip=nulliparous (white), I=inv=involution (gray), data are presented as mean +/− SEM.
Figure 2
Figure 2. Postpartum involution drives tumor cell invasion
(a) GFP+ tumor cells 3 weeks post injection, scalebar=100 µm. (b) IHC image of GFP+ cells in mammary tissue 3 d post-injection, scalebar=50 µm, inset GFP+ tumor cells, scalebar=10 µm, and quantification of dispersed GFP+ cell clusters by group, *p=0.0129, n=3 (nulliparous), n=5 (involution), unpaired t test. (c) IHC image of tumor cells in mammary blood vessel 3 d post-injection, scalebar=10 µm. Quantification of tumor cells in peripheral blood 1 and 3 d post-injection, *p=0.04, n=3 per group, unpaired t. (d) Fluorescent in situ hybridization for COT-1 DNA (human=red, mouse=green) and DAPI-stained nuclei (blue), scalebar=50 µm. (e) Left axis, individual mammary tumor volumes (black bars). Right axis, qRT-PCR analysis of lung for human β2M transcripts in arbitrary units (a.u.) after normalizing to actin. Inset, average β2M expression *p=0.0046, n=9 (nulliparous #1-9), n=8 (involution #10-17), unpaired t test. (f) Right, average in vitro wound closure of Involution and Nulliparous Group tumor cell populations on collagen 2, 4, and 6 h post-scrape *p=0.034, **p=0.045, ***p=0.040, n=7 (nulliparous), n=8 (involution). Left, scrape images of Involution Group tumor cell populations at 0 h and 6 h (scalebar=50 µm). (g) Left, average number of invasive tumor cells in transwell assay, n=5 (nulliparous), n=6 (involution), *p=0.0491 unpaired t-test. Right, filter images, scalebar=50 µm. (h) Left axis, volumes of tumors utilized for tumor cell isolation (black bars). Right axis, wound closure of individual tumor cell populations 6h post-scrape. N=nullip=nulliparous (white), I=inv=involution (gray), data are mean +/− SEM.
Figure 3
Figure 3. Fibrillar collagen and COX-2 mediate tumor cell invasiveness
(a) Trichrome (top) and COX-2 (bottom) IHC-stained tumor, arrows=dense collagen, arrowhead=sparse collagen, scalebar=50 µm. (b) Right, percent tumor COX-2+ by IHC, *p=0.0275, n=9 (nulliparous), n=5 (involution), unpaired t test Left, COX-2 IHC images, scalebar=100 µm. (c) Western blot showing expression of COX-2 in tumor cell populations, *p=0.0274, n=3 per group, unpaired t test. (d) In vitro wound closure by tumor cells on collagen +/− 20 µM COX-2 inhibitor celecoxib (CXB, black) at 6h post-scrape, *p=0.019, n=3 cell populations per group, unpaired t test. Inset: individual tumor cell population data. (e) Left, % COX-2+ organoids by IHC in Matrigel™ or Matrigel™ + 10% (10), 20% (20), and 40% (40) collagen, *p<0.0001, one-way ANOVA. Right, 3D-organoid COX-2 IHC images, scalebar=50 µm. (f,g,h) % organoids rounded(1), dysmorphic(2), or invasive(3) on (f) 0 and 40% collagen, *p<0.0001, n=3 wells per condition, one way ANOVA, (g) on 40C + DMSO solvent, 40C + 2.5 µm CXB, 40C + 5 µm CXB, *p<0.0001, n=3 wells per condition, one way ANOVA and (h) on 40C + shGFP and 40C + shCOX-2, *p<0.0001, n=3 wells per condition, one way ANOVA. (i) Left, SHG image of collagen surrounding nulliparous and involuting ducts, higher magnifications (yellow box) below, scalebar=10 µm. Arrow: radially aligned collagen, scalebar=50 µm. (j) Organoid type on 0C, 20% collagen + 20% gelatin (20/20), 40C and 40% gelatin (40G), *p<0.0001, n=3 wells per condition, one way ANOVA. Data are mean +/− SEM and representative of triplicate studies.
Figure 4
Figure 4. COX-2 inhibition mitigates the tumor promotional effects of involution
(a) Average tumor volume for involution group (I) and involution+CXB group (I + CXB) mice at 3 weeks post-injection, p=0.0205, n=12, unpaired t test. (b) % glands with dispersed GFP+ tumor cells in mammary glands at 3 d post-injection, p=0.018, n=12, unpaired t test. (c) % glands with dispersed GFP+ tumor cells in mammary glands at 3 weeks post-injection, p=0.0033, n=12, unpaired t test. Data are presented as mean +/− SEM. (d) SHG imaging of collagen surrounding control involuting (Inv)and CXB treated involuting ducts (Inv + CXB), scalebar=50 µm. (e) Collagen intensity by SHG versus distance from involuting mouse mammary ducts (red, n=21 ducts, 3 mice) compared to involuting + CXB (green, n=22 ducts, 3 mice) and to nulliparous (black, n=12 ducts, 3 mice), p<0.001 Involution vs Involution + CXB between 5–10 um, student’s t test. (f)A model depicting COX-2, derived from the involuting mammary gland, mediated upregulation of collagen fibrillogenesis and subsequent upregulation of COX-2 and invasion (brown cells) in tumor cells exposed to involution collagen.
Figure 5
Figure 5. Evidence for collagen and COX-2 contributing to postpartum breast cancer
(a) Quantification of collagen intensity by SHG versus distance from human breast ducts, black=nulliparous, red=involution (13–14 ducts per case, 3 cases per group), p<0.00001, student’s t test. Data are presented as mean +/− SEM. (b) SHG imaging of collagen in breast tissue from involuting (inv) and nulliparous (nullip) women, scalebar=50 µm. (c) Multivariate Cox Analysis of relapse free survival in 345 breast tumors diagnosed in women ≤45 years of age who relapsed within five years of diagnosis for effect of high Col1A1 and COX-2 (gene name: PTGS2) expression (23%) (1-red dashed line), all other combinations of Col1A1 and COX-2 expression (77%) (0-blue line), and ER status (58% pos and 42% neg). High Col1A1 and COX-2 is the only significant variable p=0.018. Univariate analysis of (d) high COX-2 and (e) high COL1A1 and relapse free survival in 345 breast tumors diagnosed in women ≤45 years of age who relapsed within five years of diagnosis. (f) Left, images of human DCIS lesions stained for COX-2 by IHC, scalebar=50 µm, * normal adjacent tissue. (g) percent area positive for COX-2 signal quantitated by quantitative IHC methods, p= 0.0266 n=11 nulliparous cases and 22 cases diagnosed ≤ 10 yrs postpartum (2–13 DCIS lesions examined per case), unpaired t-test. See Supplementary Fig 4c for data set characteristics. Nullip=nulliparous (white), PP=postpartum (gray), black bars indicate group average.
Figure 6
Figure 6. Postpartum ibuprofen treatment reduces tumor volume, burden, COX-2, and lung infiltration
(a) In vitro wound closure untreated (U), vehicle treated (V), and ibuprofen treated (200µg mL−1) (Ibu), *p=0.0001, n=4 wells per condition, unpaired t test. (b) Collagen quantification by SHG as intensity versus distance from rat mammary ducts, black=nulliparous, red=involution, green = involution + ibuprofen (3 rats per Group) p<0.001, involution v involution+ibuprofen between 5–10 um from duct, student’s t test. (c) H&E images of involution and involution+ibuprofen group mouse mammary tissues 2 weeks post-treatment, top scalebars=150 µm, bottom scalebars=40 µm. (d) Average tumor volume in nulliparous (N), involution (I), +/− ibuprofen (Ibu) group mice, *p=0.00373, one way ANOVA, ‡p≤0.035, type IIIF test for group effect in additive model, n=6 (nulliparous), n=8 (involution), n=4 (nulliparous + ibuprofen), n=5 (involution + ibuprofen). (e) Tumor burden, 6 week timepoint, *p=0.0255, n=8 (involution), n=9 (involution+ibuprofen), unpaired t test. (f) Quantitation of tumor COX-2 expression at 6 week timepoint, *p≤0.036, unpaired t test, n=9 (nulliparous), n=9 (involution), n=6 (nulliparous+ibuprofen), n=9 (involution+ibuprofen). (g) Statistical modeling of mouse lung signal for human-specific β2M by qRT-PCR across time, ‡p=0.027, t test of group effect. (h) Left axis, average mammary tumor volume per Group demonstrating size-match between groups, (light gray). Right axis, mouse lung signal for human-specific β2M by qRT-PCR analysis, *p=0.011, n=5, Wilcoxon test, involution=dark gray, involution+ibuprofen=black. Data are mean +/− SEM.

References

    1. Lord SJ, et al. Breast cancer risk and hormone receptor status in older women by parity, age of first birth, and breastfeeding: a case-control study. Cancer Epidemiol Biomarkers Prev. 2008;17:1723–1730. - PMC - PubMed
    1. Lambe M, et al. Transient increase in the risk of breast cancer after giving birth. The New England journal of medicine. 1994;331:5–9. - PubMed
    1. Mathews TJ, Hamilton BE. Delayed Childbearing: More Women Are Having Their First Child Later in Life. Vol. 21. Hyattsville, MD: National Center for Health Statistics; 2009. - PubMed
    1. Lyons TR, Schedin PJ, Borges VF. Pregnancy and breast cancer: when they collide. Journal of mammary gland biology and neoplasia. 2009;14:87–98. - PMC - PubMed
    1. Daling JR, Malone KE, Doody DR, Anderson BO, Porter PL. The relation of reproductive factors to mortality from breast cancer. Cancer Epidemiol Biomarkers Prev. 2002;11:235–241. - PubMed

Publication types

MeSH terms