Review
. 2011 Aug 8;9(9):683-94.
doi: 10.1038/nrmicro2634.

Imaging mass spectrometry in microbiology

Affiliations
Review

Imaging mass spectrometry in microbiology

Jeramie D Watrous et al. Nat Rev Microbiol. .

Abstract

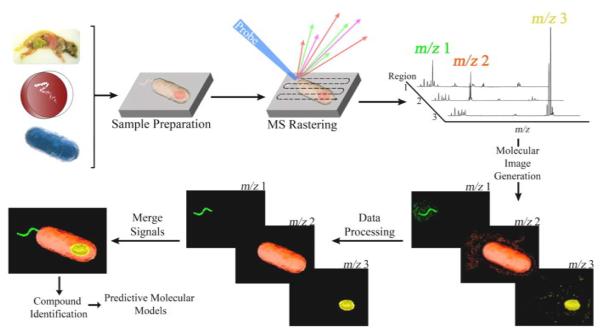
Imaging mass spectrometry tools allow the two-dimensional visualization of the distribution of trace metals, metabolites, surface lipids, peptides and proteins directly from biological samples without the need for chemical tagging or antibodies, and are becoming increasingly useful for microbiology applications. These tools, comprising different imaging mass spectrometry techniques, are ushering in an exciting new era of discovery by enabling the generation of chemical hypotheses based on the spatial mapping of atoms and molecules that can correlate to or transcend observed phenotypes. In this Innovation article, we explore the wide range of imaging mass spectrometry techniques that is available to microbiologists and describe the unique applications of these tools to microbiology with respect to the types of samples to be investigated.


Figures

Figure 1
Figure 1. Overview of imaging mass spectrometry workflows
Microbial samples are prepared (i.e. cryosectioned, isolated, fixed) and mounted on a target surface after which additional preparation may be required, such as matrix application or drying. Software is then used to program a raster grid (for pulse based surface probes) or sampling path (for continuous based surface probes) across the surface of the sample. In an automated fashion, the mass spectrometer will then collect mass spectra from thousands of unique locations throughout the sample surface with each sampling location containing unique mass spectra. The collective data set is then combined into a single image where the relative intensity of individual compounds can be visualized using false color gradients. The data is then processed using software algorithms (e.g. data normalization, hot spot suppression, segmentation) in order to correct for pixel-to-pixel variability. The resulting molecular signals can then be merged with additional IMS signals or other types of data including fluorescence and optical images which can then be used to identify interesting compounds and begin building predictive models for biology.
Figure 2
Figure 2. Overview of various surface scanning probes used for IMS analysis of microbial samples
Each ion source offers unique benefits and challenges that grant each technique a unique niche in microbial research. The descriptions above represent the abilities of each ion source under typical configurations. Also note that while mounting surfaces for each source are typically conductive or non-conductive, the samples themselves can usually be conductive or insulating. Abbreviations: AP (atmospheric pressure), IP (intermediate pressure), UHV (ultra high vacuum), HV (high voltage), MS (mass spectrometer), DHB (2,5-dihydroxybenzoic acid), CHCA (α-cyano-4-hydroxycinnamic acid), UV (ultra-violet), VUV (vacuum ultra-violet), IR (infrared), TOF (time-of-flight). A. The incident angle of the primary ion beam in the Cameca NanoSIMS 50 and 50L is normal to the sample surface (as opposed to 40° as shown) B: Static SIMS is typically stated as being able to detect compounds up to 10,000 Da; however, detection intact molecules above 1,500 Da from biological samples is rarely reported due to source induced fragmentation.
Figure 3
Figure 3. Examples of subcellular imaging mass spectrometry
(A–C) Dynamic SIMS imaging of a single Bacillus thuringiensis israelensis spore. (A) SEM image of an individual spore mounted on Si wafer. (B,C) Using a Cs+ primary ion beam, depth profile analysis (B) and surface profiling analysis (C) was performed to analyze P and Cl distribution through the spore. (DI-DIV) Dynamic SIMS imaging of nitrogen fixation and metabolite exchange between neighboring Anabaena oscillarioides cells within a single filament containing a heterocyst (Het) and two vegetative cells (Veg 1,2) as seen in the SEM image (IV). SIMS Images show high levels of carbon (I) in throughout the filament but low levels of nitrogen (II) and phosphorous (III) in the neck region between the heterocyst and vegetative cell.
Figure 4
Figure 4. Examples of imaging mass spectrometry on single and interacting colonies
(A–B) Dynamic SIMS of a single Trichodesmium filament after an 8 hour incubation with 15N2. (A) Arrows indicate areas of correlation between discrete areas of nitrogen uptake observed in the dynamic SIMS image (bottom) and cyanophycin granules identified by the TEM image (top). (B) SIMS depth profile through 2 individual cells of a filament exposed to 15N2 for 8 hours. White circle indicates cyanophycin granule that does not appear in subsequent images and red circles indicate a cyanophycin granule that is resolved with increasing depth. (C) MALDI imaging of Bacillus subtilis Py79 and ΔSpo0A colonies on dried nutrient agar using Universal MALDI matrix (Sigma-Aldrich Cat. No. 50149), which is a 1:1 mixture of 2,5-dihydroxybenzoic acid and α-Cyano-4-hydroxycinnamic acid matrices. MALDI images showed induction of the possible cannibalistic factors sporulation killing factor (SKF) and sporulation delaying protein (SDP) in strain Py79 by strain ΔSpo0A (CI: MALDI IMS images, CII: MALDI IMS images overlay with optical images). To confirm the identity of SKF as the ion at m/z 2782, an IPTG inducible promoter was placed in front of the skf gene and subsequent MALDI imaging.
Figure 5
Figure 5. Example of imaging mass spectrometry on microbial communities
Static SIMS imaging of microbes within soil samples imprinted on a Si wafer. Using a Ga+ primary ion gun, 15N assimilation in bacterial samples (I and II) and fungal hyphae (III) was measured. (I) The combined signal of 26CN and 27CN in rod shaped bacteria are shown in blue while SiO, indiciative of inorganic soil material, is shown in yellow. (II) The combined 26CN/27CN signal from (I) is separated into 26CN (red) and 27CN(green) to show 15N uptake. (III) 15N uptake in neighboring fungal hyphae is shown with 26CN displayed in red and 27CN displayed in green.
Figure 6
Figure 6. Examples of imaging mass spectrometry on host-microbe interactions
Dynamic SIMS analysis of nitrogen fixation of Teredinibacter turnerae and other bacterial symbionts in the gill region of the shipworm Lyrodus pedicellatus. The image is represented as a mosaic of 100μm × 100μm tiles using a Cs+ primary ion beam. Shipworms were exposed to 15N labeled N2 with subsequent SIMS imaging showing high levels of 15N incorporation in the gland of Deshayes and the bacteriocytes. (B) MALDI IMS analysis of the microbial symbionts inhabiting Acromyrmex echinatior leaf-cutting ants. Left shows optical image of worker ant mounted on MALDI target plate with the red circles indicating spots of valinomycin standards. MALDI image to the right showing distribution of valinomycin (produced by Streptomyces symbionts) on the integument of the ant.

References

    1. Amstalden van Hove ER, Smith DF, Heeren RMA. A concise review of mass spectrometry imaging. J. Chromatogr. A. 2010;1217:3946–3654. - PubMed
    2. This is an expert but concise review of some of the imaging mass spectrometry tools used describing the applications in other fields such as pathology.

    1. Winograd N, Garrison NJ. Biological cluster mass spectrometry. Annu. Rev. Phys. Chem. 2010;61:305–322. - PMC - PubMed
    1. Schwamborn K, Caprioli RM. Molecular imaging by mass spectrometry : looking beyond classical histology. Nat. Rev. Cancer. 2010;10:639–646. - PubMed
    2. This is an expert review by one of the main developers of the MALDI based imaging field describing the use of imaging mass spectrometry in cancer investigations.

    1. McDonnell LA, Heeren RMA. Imaging mass spectrometry. Mass Spectrom. Rev. 2007;26:606–643. - PubMed
    1. Boxer SG, Kraft ML, Weber PK. Advances in imaging secondary ion mass spectrometry for biological samples. Annu. Rev. Biophys. 2009;38:53–74. - PubMed

Publication types

MeSH terms