

FDM: a graph-based statistical method to detect differential transcription using RNA-seq data
- PMID: 21824971
- PMCID: PMC3179659
- DOI: 10.1093/bioinformatics/btr458
FDM: a graph-based statistical method to detect differential transcription using RNA-seq data
Abstract
Motivation: In eukaryotic cells, alternative splicing expands the diversity of RNA transcripts and plays an important role in tissue-specific differentiation, and can be misregulated in disease. To understand these processes, there is a great need for methods to detect differential transcription between samples. Our focus is on samples observed using short-read RNA sequencing (RNA-seq).
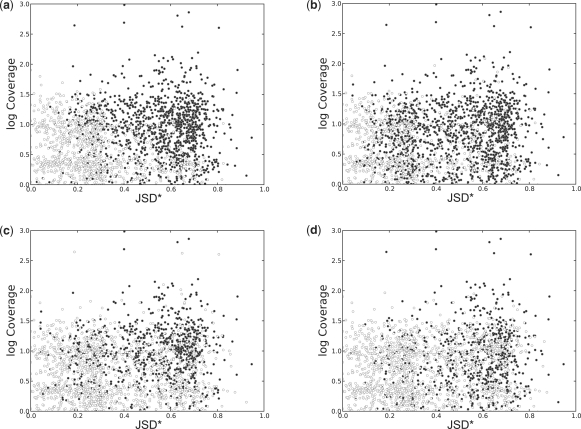
Methods: We characterize differential transcription between two samples as the difference in the relative abundance of the transcript isoforms present in the samples. The magnitude of differential transcription of a gene between two samples can be measured by the square root of the Jensen Shannon Divergence (JSD*) between the gene's transcript abundance vectors in each sample. We define a weighted splice-graph representation of RNA-seq data, summarizing in compact form the alignment of RNA-seq reads to a reference genome. The flow difference metric (FDM) identifies regions of differential RNA transcript expression between pairs of splice graphs, without need for an underlying gene model or catalog of transcripts. We present a novel non-parametric statistical test between splice graphs to assess the significance of differential transcription, and extend it to group-wise comparison incorporating sample replicates.
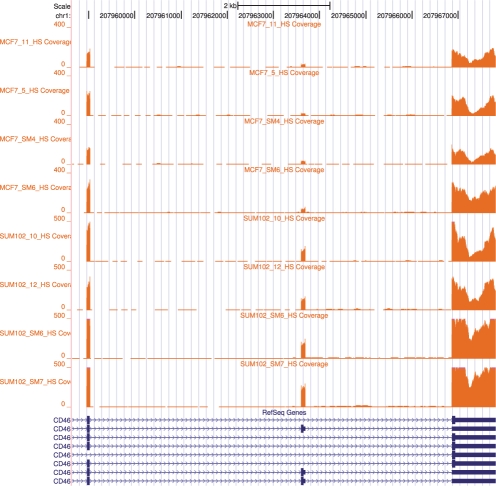
Results: Using simulated RNA-seq data consisting of four technical replicates of two samples with varying transcription between genes, we show that (i) the FDM is highly correlated with JSD* (r=0.82) when average RNA-seq coverage of the transcripts is sufficiently deep; and (ii) the FDM is able to identify 90% of genes with differential transcription when JSD* >0.28 and coverage >7. This represents higher sensitivity than Cufflinks (without annotations) and rDiff (MMD), which respectively identified 69 and 49% of the genes in this region as differential transcribed. Using annotations identifying the transcripts, Cufflinks was able to identify 86% of the genes in this region as differentially transcribed. Using experimental data consisting of four replicates each for two cancer cell lines (MCF7 and SUM102), FDM identified 1425 genes as significantly different in transcription. Subsequent study of the samples using quantitative real time polymerase chain reaction (qRT-PCR) of several differential transcription sites identified by FDM, confirmed significant differences at these sites.
Availability: http://csbio-linux001.cs.unc.edu/nextgen/software/FDM CONTACT: darshan@email.unc.edu
Supplementary information: Supplementary data are available at Bioinformatics online.
Figures
 =
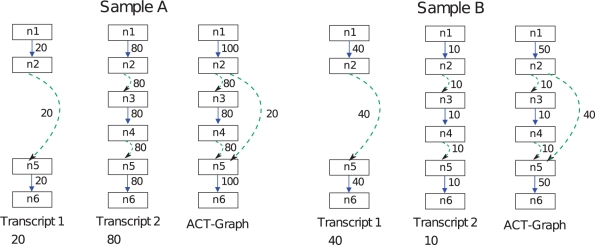
=  . The JSD is computed using the ground truth knowledge of the transcript abundance vectors. VA = [0.2,0.8] and VB = [0.8,0.2].
  = 0.28. Thus, JSD* = 0.53 is the magnitude of differential transcription representing ground truth.
Similar articles
-
DiffSplice: the genome-wide detection of differential splicing events with RNA-seq.Nucleic Acids Res. 2013 Jan;41(2):e39. doi: 10.1093/nar/gks1026. Epub 2012 Nov 15. Nucleic Acids Res. 2013. PMID: 23155066 Free PMC article.
-
Next-generation sequencing facilitates quantitative analysis of wild-type and Nrl(-/-) retinal transcriptomes.Mol Vis. 2011;17:3034-54. Epub 2011 Nov 23. Mol Vis. 2011. PMID: 22162623 Free PMC article.
-
GeneScissors: a comprehensive approach to detecting and correcting spurious transcriptome inference owing to RNA-seq reads misalignment.Bioinformatics. 2013 Jul 1;29(13):i291-9. doi: 10.1093/bioinformatics/btt216. Bioinformatics. 2013. PMID: 23812996 Free PMC article.
-
RNA-Seq: a revolutionary tool for transcriptomics.Nat Rev Genet. 2009 Jan;10(1):57-63. doi: 10.1038/nrg2484. Nat Rev Genet. 2009. PMID: 19015660 Free PMC article. Review.
-
RNA sequencing: advances, challenges and opportunities.Nat Rev Genet. 2011 Feb;12(2):87-98. doi: 10.1038/nrg2934. Epub 2010 Dec 30. Nat Rev Genet. 2011. PMID: 21191423 Free PMC article. Review.
Cited by
-
A survey of best practices for RNA-seq data analysis.Genome Biol. 2016 Jan 26;17:13. doi: 10.1186/s13059-016-0881-8. Genome Biol. 2016. PMID: 26813401 Free PMC article. Review.
-
DiffSplice: the genome-wide detection of differential splicing events with RNA-seq.Nucleic Acids Res. 2013 Jan;41(2):e39. doi: 10.1093/nar/gks1026. Epub 2012 Nov 15. Nucleic Acids Res. 2013. PMID: 23155066 Free PMC article.
-
Efficient experimental design and analysis strategies for the detection of differential expression using RNA-Sequencing.BMC Genomics. 2012 Sep 17;13:484. doi: 10.1186/1471-2164-13-484. BMC Genomics. 2012. PMID: 22985019 Free PMC article.
-
Functional genomic analysis and neuroanatomical localization of miR-2954, a song-responsive sex-linked microRNA in the zebra finch.Front Neurosci. 2014 Dec 16;8:409. doi: 10.3389/fnins.2014.00409. eCollection 2014. Front Neurosci. 2014. PMID: 25565940 Free PMC article.
-
Leveraging transcript quantification for fast computation of alternative splicing profiles.RNA. 2015 Sep;21(9):1521-31. doi: 10.1261/rna.051557.115. Epub 2015 Jul 15. RNA. 2015. PMID: 26179515 Free PMC article.
References
-
- Heber S., et al. Splicing graphs and EST assembly problem. Bioinformatics. 2002;18(Suppl. 1):S181–S188. - PubMed
