

Synthesizing epidemiological and economic optima for control of immunizing infections
- PMID: 21825129
- PMCID: PMC3161560
- DOI: 10.1073/pnas.1101694108
Synthesizing epidemiological and economic optima for control of immunizing infections
Abstract
Epidemic theory predicts that the vaccination threshold required to interrupt local transmission of an immunizing infection like measles depends only on the basic reproductive number and hence transmission rates. When the search for optimal strategies is expanded to incorporate economic constraints, the optimum for disease control in a single population is determined by relative costs of infection and control, rather than transmission rates. Adding a spatial dimension, which precludes local elimination unless it can be achieved globally, can reduce or increase optimal vaccination levels depending on the balance of costs and benefits. For weakly coupled populations, local optimal strategies agree with the global cost-effective strategy; however, asymmetries in costs can lead to divergent control optima in more strongly coupled systems--in particular, strong regional differences in costs of vaccination can preclude local elimination even when elimination is locally optimal. Under certain conditions, it is locally optimal to share vaccination resources with other populations.
Conflict of interest statement
The authors declare no conflict of interest.
Figures

 (
( = 1.5 in blue lines,
  = 5 in green lines) for two different values of per-capita cost of infection (solid lines, moderate cost; dashed lines, high cost). Vertical colored lines indicate the critical level of coverage, pc = 1 − 1/
 , needed to eliminate the disease in the absence of economic constraints. Parameters: 1/ν = 14, 1/μ = 80 y. (B) Total costs for the case when there is no immigration (combined vaccination and disease costs). Solid (moderate cost) and dashed (high cost) blue and green lines represent the total coverage for, respectively,
  = 1.5 and
  = 5, until the elimination coverage indicated by colored vertical lines. Dotted line represents the coverage cost after the elimination. Black vertical lines indicate the level of coverage that minimizes total costs (solid, moderate cost; dashed, high cost) given by Eq. 3. (C) Optimal coverage as a function of immigration likelihood in the one-patch SIR model with immigration. Solid line, moderate infection cost; dashed line, high infection cost. Vertical colored lines indicate the level of immigration for which equilibrium prevalence and total costs are shown in D and E: blue, η = 0; green, η = 0.00065; red, η = 0.01.
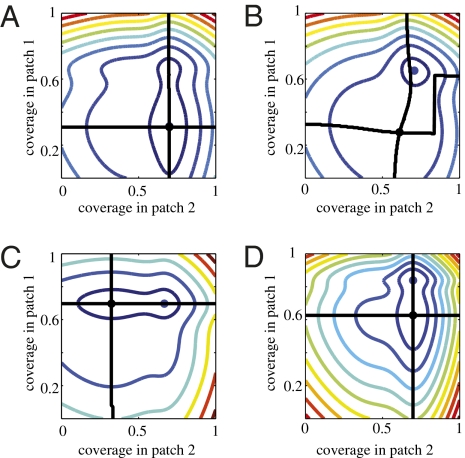
 =
=  = 5, cI1 = cI2 = 5. (B) Same as A but strong coupling, η = 10μ. (C) Asymmetric disease costs, cI1 > cI2,
  =
=  = 5, a1 = a2 = 0.1, η = μ. (D) Asymmetry in
  values,
  >
>  , cI1 = cI2, = 5, a1 = a2 = 0.1, η = μ.
 =
=  = 3; a1 = 1, a2 = 0.5; cI1 = cI2 5; η = 10μ.
References
-
- Fenner F. A successful eradication campaign. Global eradication of smallpox. Rev Infect Dis. 1982;4:916–930. - PubMed
-
- Ferrari MJ, et al. The dynamics of measles in sub-Saharan Africa. Nature. 2008;451:679–684. - PubMed
-
- Orenstein W, et al. Technical Consultative Group to the World Health Organization on the Global Eradication of Poliomyelitis. “Endgame” issues for the global polio eradication initiative. Clin Infect Dis. 2002;34:72–77. - PubMed
-
- Roberts L. Polio endgame. Polio: The final assault? Science. 2004;303:1960–1968. - PubMed
Publication types
MeSH terms
Grants and funding
LinkOut - more resources
Full Text Sources
Medical
Molecular Biology Databases
